Troubleshooting
FAQ
Problem: “I can’t see the video”
First step would be to make sure that you did grant your browser the permission to access the camera/microphone.
Look for the following icon in the top right corner of your browser window, inside the browser address bar:

If you see this icon, it means that the access to the camera and microphone is blocked, so you will need to change this setting in order for the camera and microphone to be enabled.
I received a call from PSTN but I can’t see the video
Usually, the calls from PSTN comes without video, so a black image is displayed instead the remote video. This is a normal behavior and you can talk normally with your remote peer.
I have my user logged on the mobile application, can I log into another device?
It depends on you specific deployment, but usually, yes, you can log on several devices and your status, calls, and other actions will be logged and activated from all of your logged devices. Short answer: yes, you will receive chat and calls on both devices.
How to set up mobile devices with a personalization layer over Android OS
In the case of having to set your app on a mobile device with heavy layers of personalization (Huawei, Xiaomi,etc), there are some parameters you should adjust to have a clean and satisfactory experience.
Keep in mind this explanation is in a general way, each brand has its own UI and settings, after installing our app you must go to SETTINGS → APPS → APPS SETTINGS and then go to Collaborator, once there:
On AUTOSTART or AUTOMATIC START set it to enable.
On OTHER PERMISSIONS settings you will see different options such as SHOW ON LOCK SCREEN, SHOW POP UP WINDOWS WHILE ON BACKGROUND, VISUALIZATION OF POP UP WINDOWS and PERMANENT NOTIFICATION. You should enable all the options, this will allow the app show notifications of new messages, meetings, incoming calls.
On NOTIFICATIONS should be enable SHOW NOTIFICATIONS, NOTIFICATIONS ON THE LOCK SCREEN. Some devices will have a PRIORITY setting inside here, in that case change it to the max priority possible.
And the last setting we should change would be the BATTERY SAVING and this should be set to NO RESTRICCTIONS.
All this changes are meant to make this layer of configuration the most similar to a “pure” android device and a fluent Collaborator experience.
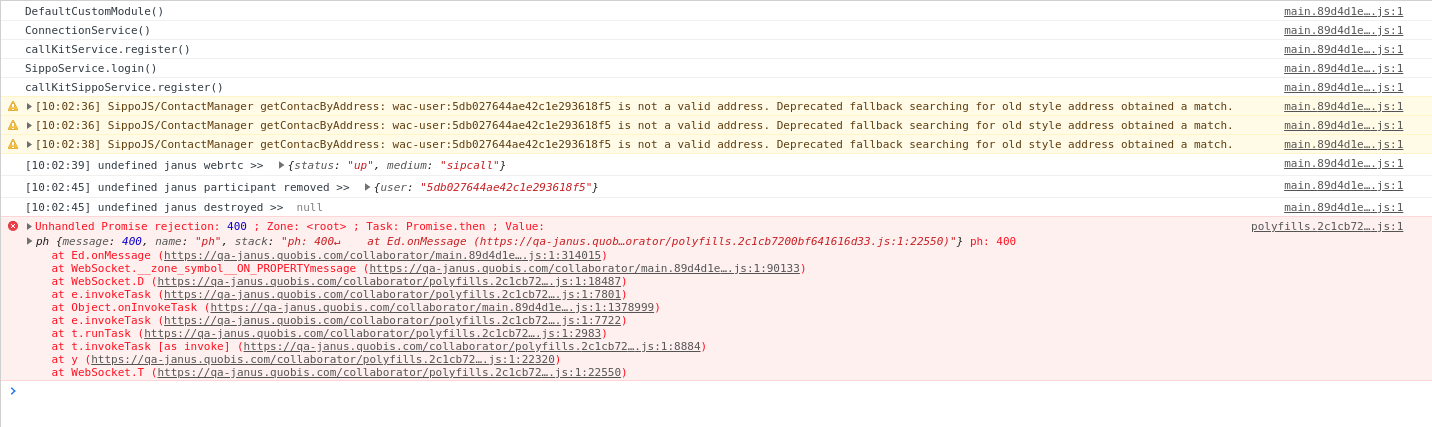
Getting console logs from the browser
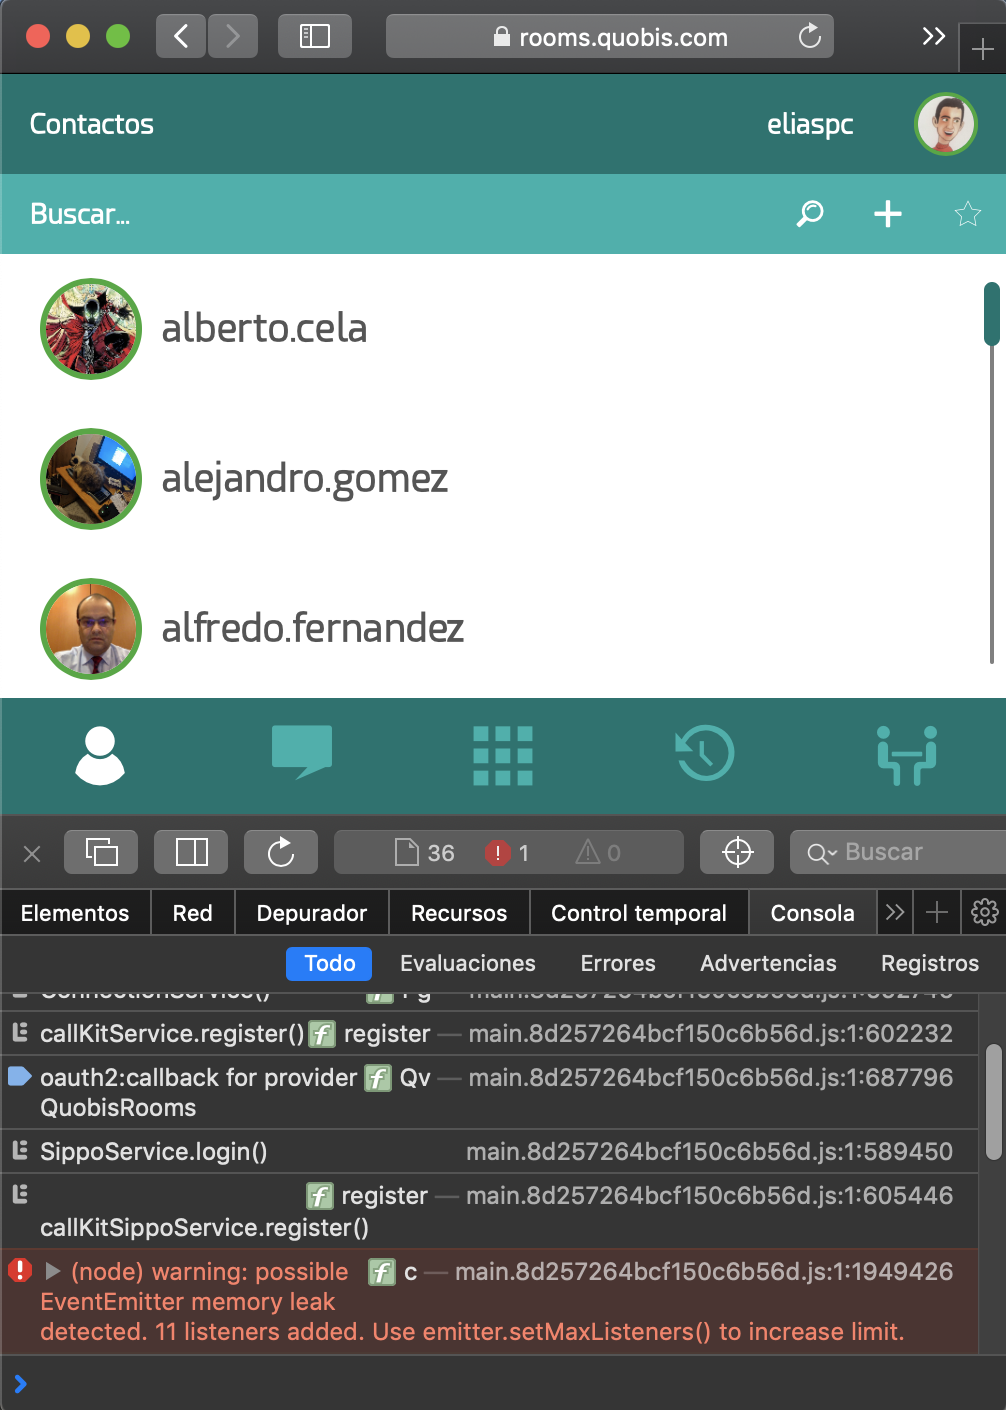
Some issues can be specific to a user, and may be difficult to troubleshoot without more detailed information. The developer console is a tool which logs the information associated with a web page, such as JavaScript, network requests, and security errors. Console logs help debug issues by giving insights into error messages that get documented by your browser.
If your issue is still happening, please help us capture the console logs for the error by performing the following steps. The following are instructions for how to open the developer console on various different browsers.
Once you have located the console, please send us a screenshot or export its contents to a plain log file using the “export” or “Save As” options (right-click).
Chrome
To show the console:
Click on Chrome settings button (the three dots in the upper-right hand corner of the browser)
Go to More tools > Developer tools. This should open up the Chrome developer tools panel.
Alternatively, you can use the keyboard shortcut Cmd+Shift+J (on Windows) or Cmd+Option+J (on Mac).
Click on the “Console” tab in the Chrome developer tools panel:
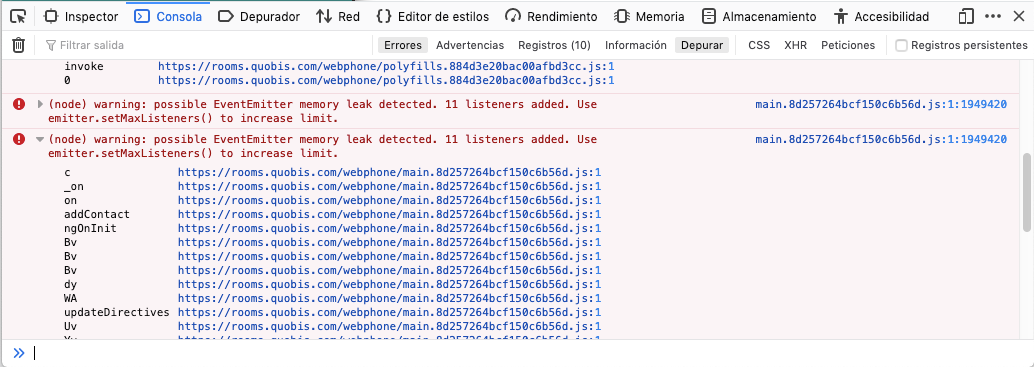
Firefox
To open the console on Firefox, use the keyboard shortcut Cmd+Shift+K (on Windows) or Cmd+Option+K (on Mac). The toolbox will appear at the bottom of the browser window, with the Web Console activated.
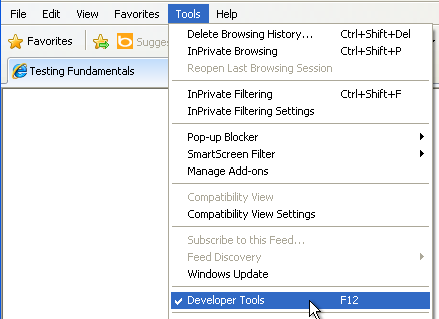
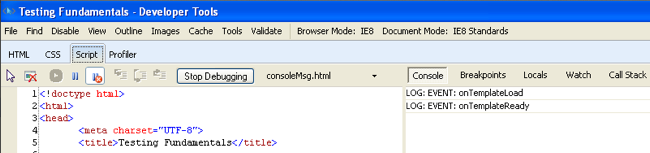
Internet Explorer
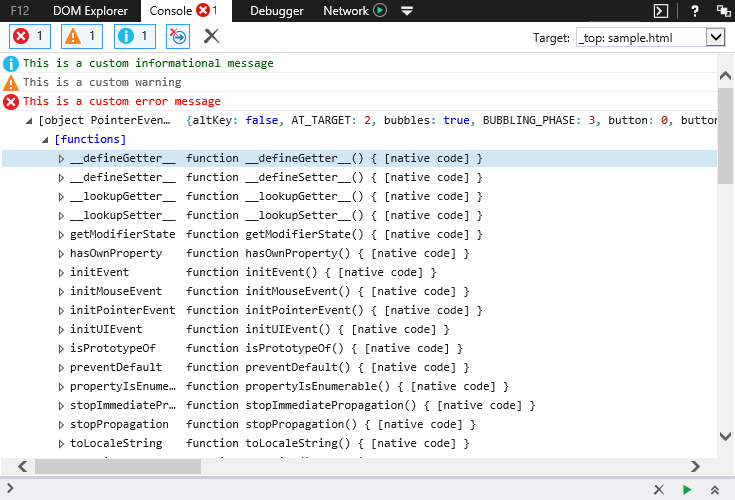
To view the console messages, open the Developer Tools. In the Internet Explorer menu bar, select Tools > Developer Tools, or press F12. IE Developer Tools In the Developer Tools window, select the Script menu item and you should see your console messages displayed.
Microsoft Edge
To open the console on Edge, hit F12 to access the F12 Developer Tools. Once in the F12 Developer Tools, navigate to the Console tab.
Safari
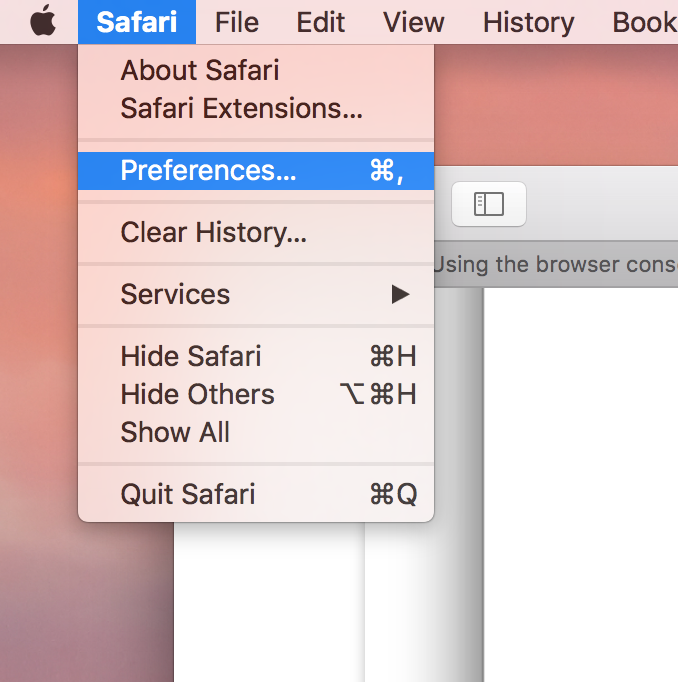
To open the console on Safari, you will first need to turn on the Develop menu. To do this, open the Safari menu in the Mac menu bar, then select Preferences.
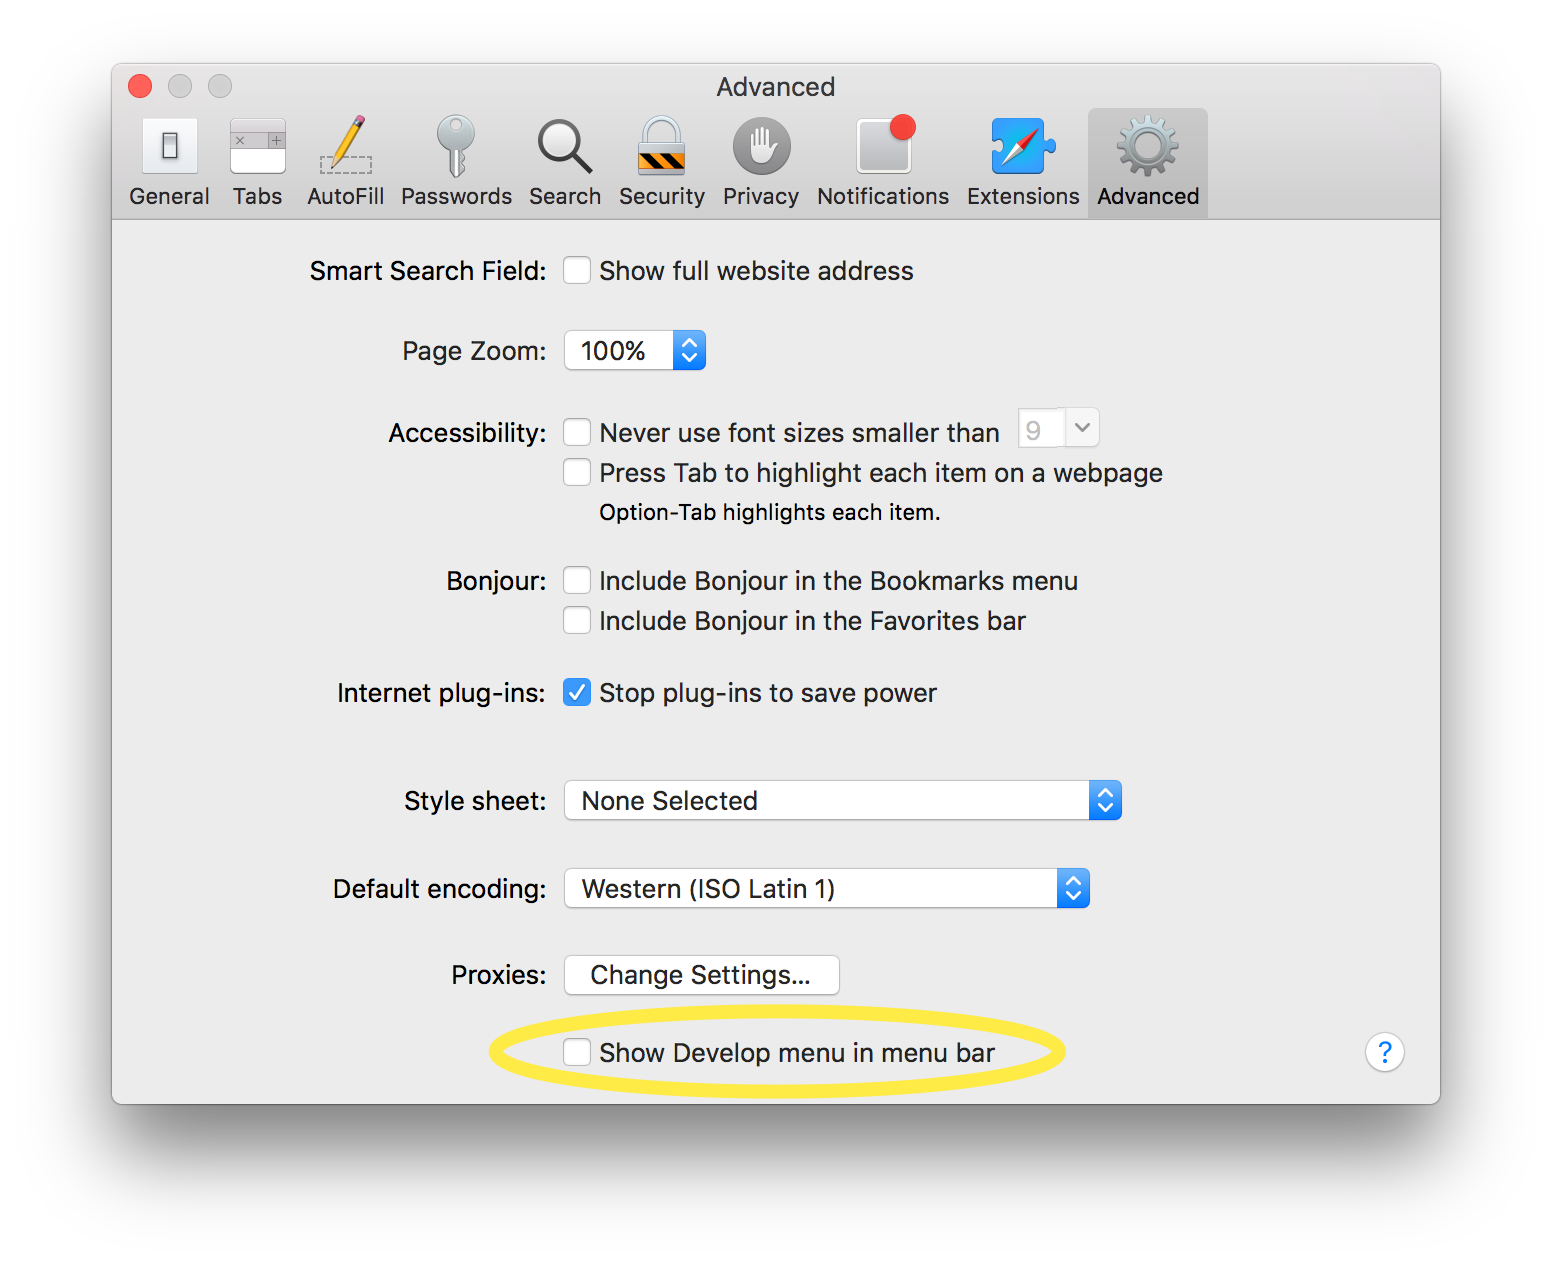
Once in the Preferences dialog, navigate to the Advanced tab, then check the “Show Develop menu in the menu bar” box.
Once the Develop menu has been enabled, you can access it in the menu bar and then select the “Show JavaScript Console” option. The JavaScript Console will show up on the bottom half of the active browser window. Alternatively, you can use the keyboard shortcut Option+Cmd+C, though note that you will need to enable the Develop menu in your Safari Preferences for this shortcut to work.
Dump WebRTC logs to file
WebRTC logs help developers and technical support in case of issues with video and audio connections. Right now only Chrome and Firefox web browser allow the user to access those logs.
The following are instructions for obtaining on both browsers the logs and downloading them to a file.
Chrome
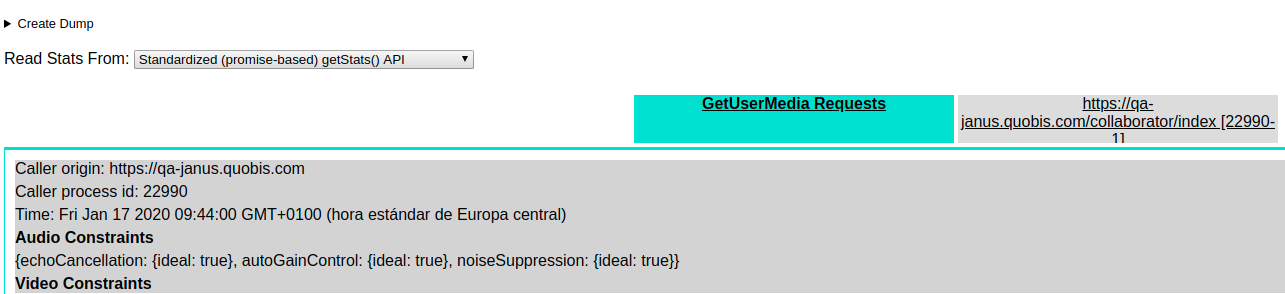
First of all you should restart the browser as it keeps track of all WebRTC connections. Once restarted, open a new tab and point to “chrome://webrtc-internals/” URL. You should see something like this:

Now open on a new tab your application and reproduce the problem. On the webrtc-internals tab should have appeared two new tabs as shown below.
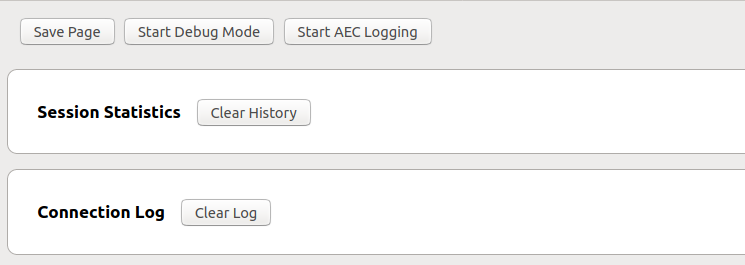
Select the one with the name of the application and click the Download the PeerConnection updates and stats data button.
After downloading, you will obtain a plain text file (extension TXT), remember to attach it to your Quobis support ticket. For debugging purposes, you can use your favorite editor to examine the content.
Firefox
For the same reason as in Chrome you should firstly restart your browser. Then, open a new tab pointing to “about:webrtc”.
Now open the application and reproduce the problem. Go back, without closing the application, to the “about:webrtc” tab and click Save Page.
After downloading, you will obtain an HTML file, which can be visualized in any browser. Remember to attach it to your Quobis support ticket.
How to get support
Please contact your system administrator for further support on how to use Sippo collaborator or visit www.quobis.com
You can also contact support sending an email to support@quobis.com