Client troubleshooting
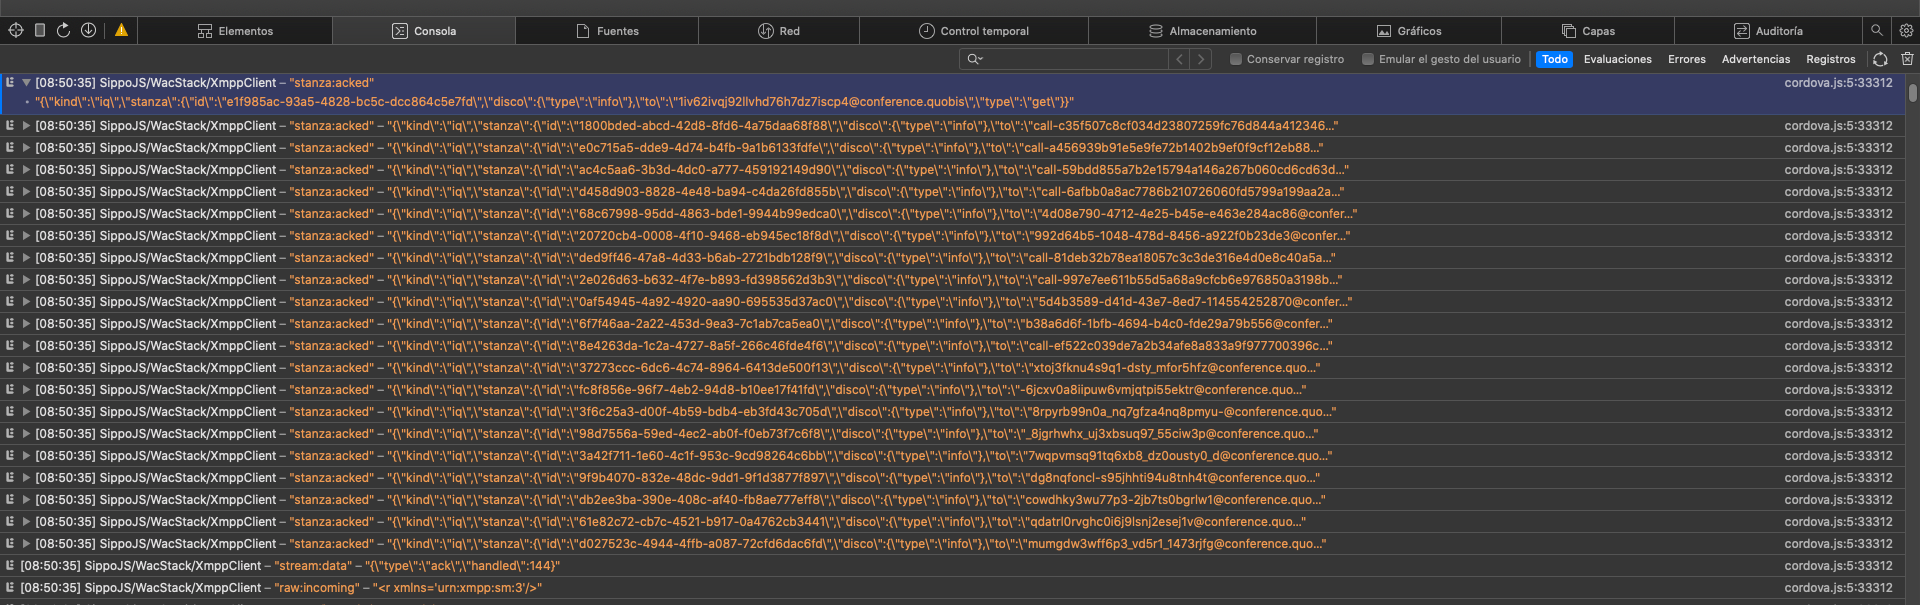
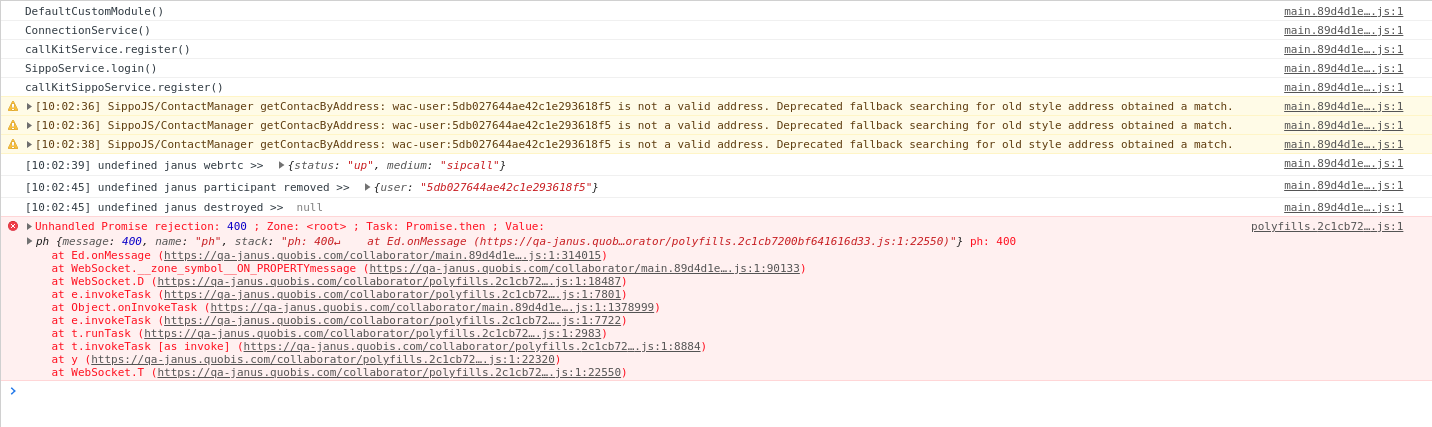
Some issues can be specific to a user, and may be difficult to troubleshoot without more detailed information. The developer console is a tool which logs the information associated with a web page, such as JavaScript, network requests, and security errors. Console logs help debug issues by giving insights into error messages that get documented by your browser.
If your issue is still happening, please help us capture the console logs for the error by performing the following steps. The following are instructions for how to open the developer console on various different browsers.
Once you have located the console, please send us a screenshot or export its contents to a plain log file using the “export” or “Save As” options (right-click).
Getting logs with the browser
Showing the console
To show the console:
Click on Chrome settings button (the three dots in the upper-right hand corner of the browser)
Go to More tools > Developer tools. This should open up the Chrome developer tools panel.
Alternatively, you can use the keyboard shortcut Cmd+Shift+J (on Windows) or Cmd+Option+J (on Mac).
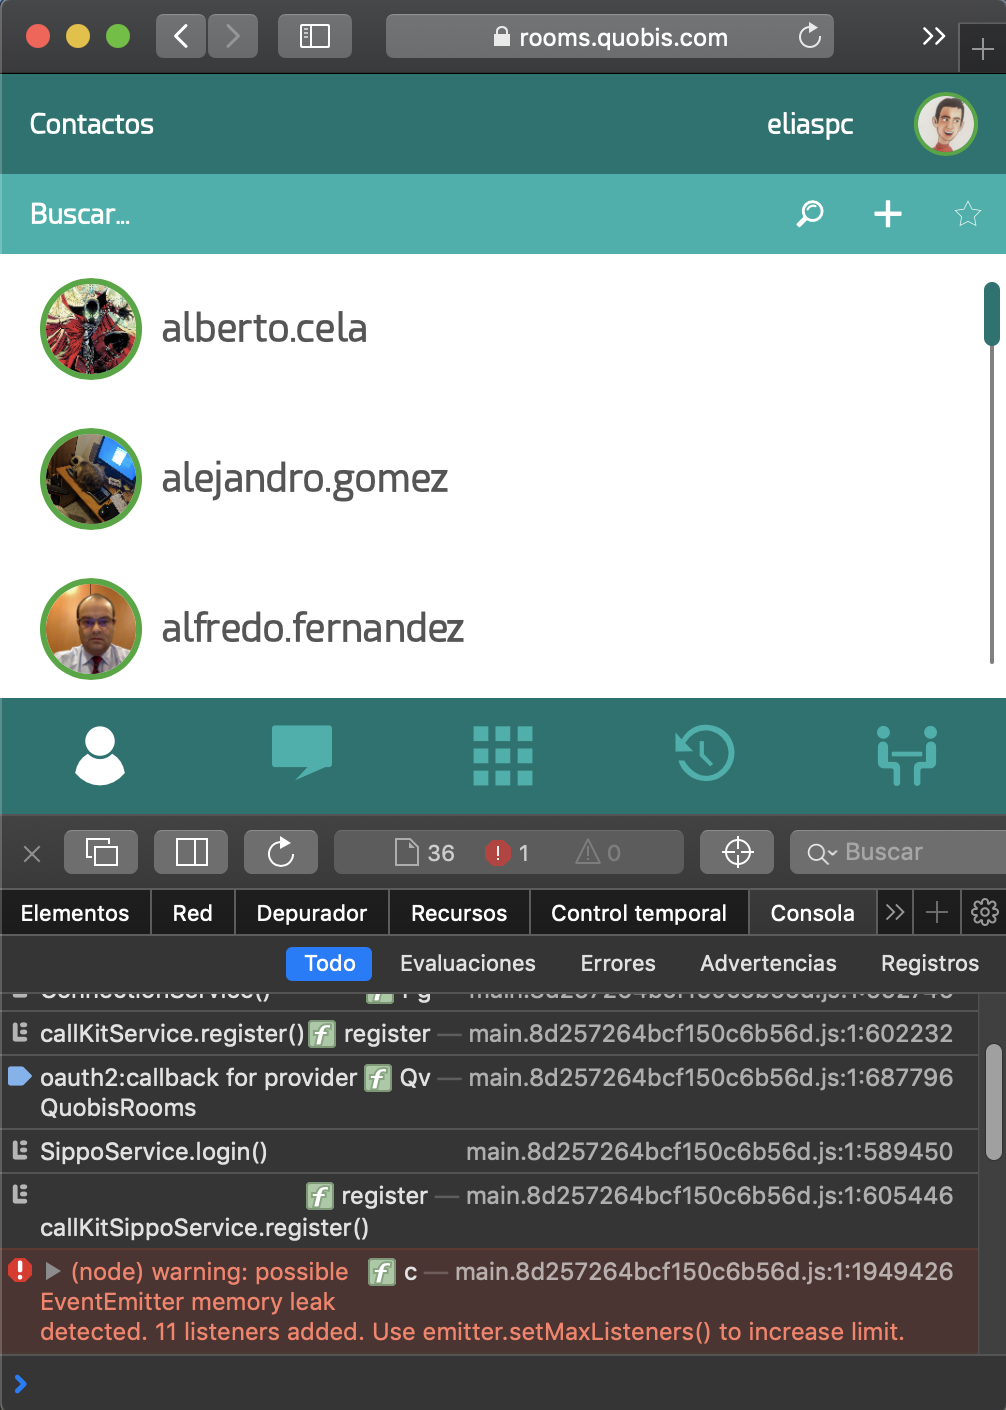
Click on the “Console” tab in the Chrome developer tools panel:
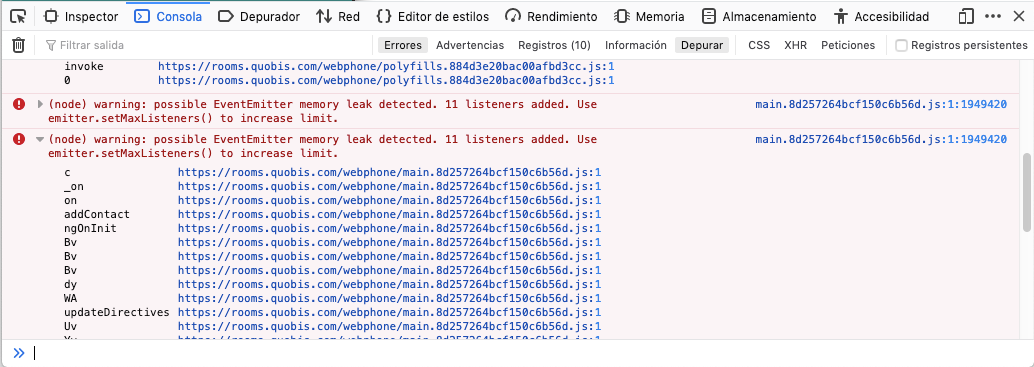
Firefox
To open the console on Firefox, use the keyboard shortcut Cmd+Shift+K (on Windows) or Cmd+Option+K (on Mac). The toolbox will appear at the bottom of the browser window, with the Web Console activated.
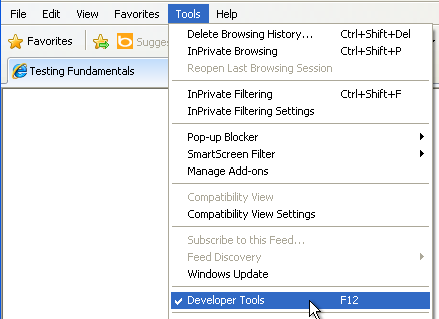
Internet Explorer
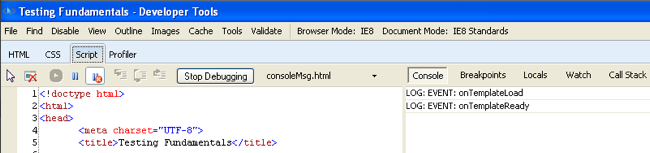
To view the console messages, open the Developer Tools. In the Internet Explorer menu bar, select Tools > Developer Tools, or press F12. IE Developer Tools In the Developer Tools window, select the Script menu item and you should see your console messages displayed.
Microsoft Edge
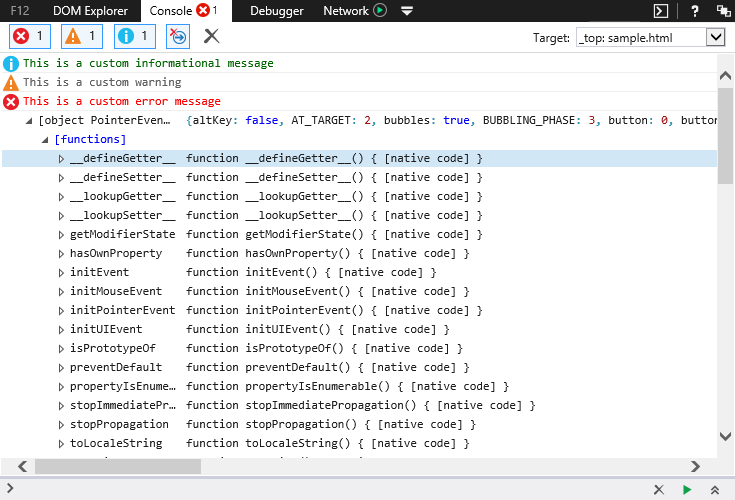
To open the console on Edge, hit F12 to access the F12 Developer Tools. Once in the F12 Developer Tools, navigate to the Console tab.
Safari
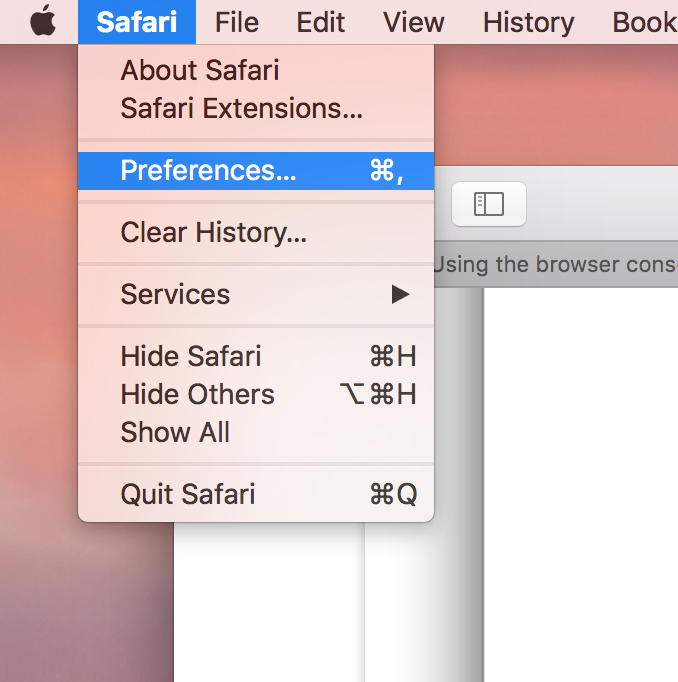
To open the console on Safari, you will first need to turn on the Develop menu. To do this, open the Safari menu in the Mac menu bar, then select Preferences.
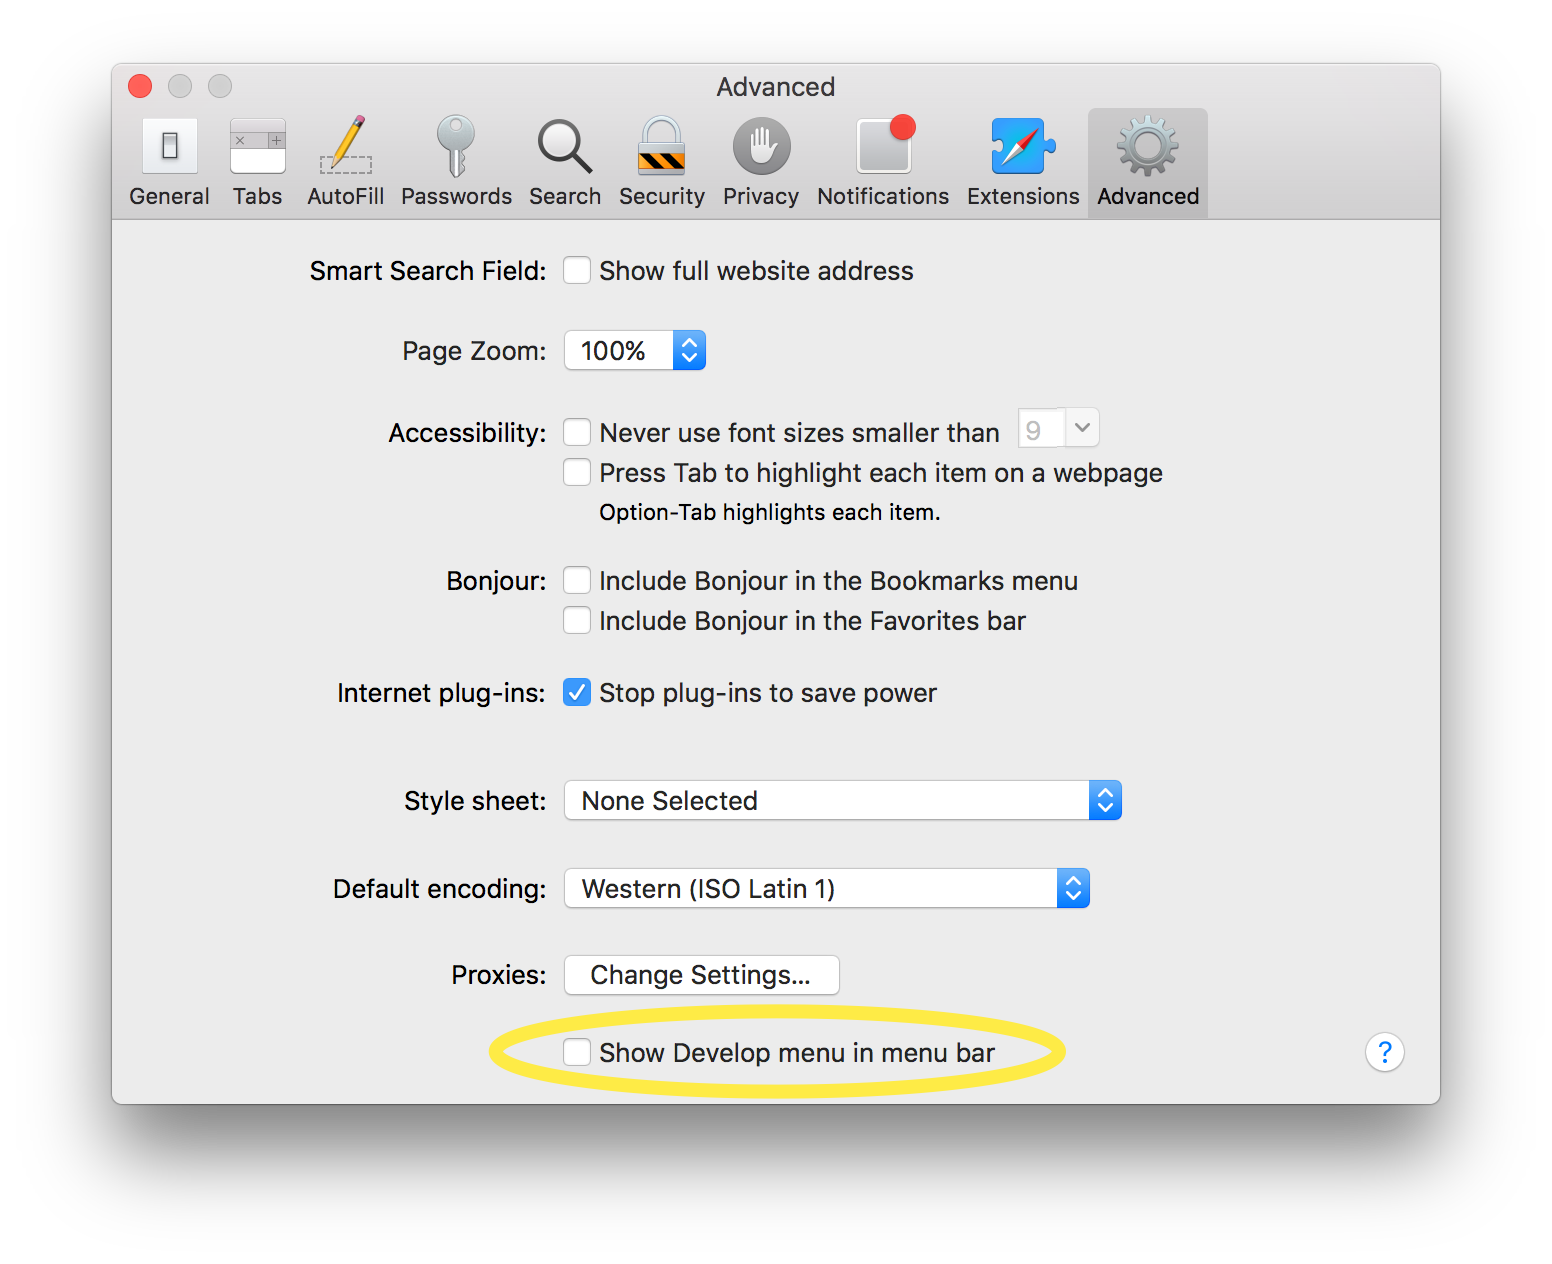
Once in the Preferences dialog, navigate to the Advanced tab, then check the “Show Develop menu in the menu bar” box.
Once the Develop menu has been enabled, you can access it in the menu bar and then select the “Show JavaScript Console” option. The JavaScript Console will show up on the bottom half of the active browser window. Alternatively, you can use the keyboard shortcut Option+Cmd+C, though note that you will need to enable the Develop menu in your Safari Preferences for this shortcut to work.
Dumping WebRTC-related logs to file
WebRTC logs help developers and technical support in case of issues with video and audio connections. Right now only Chrome and Firefox web browser allow the user to access those logs.
The following are instructions for obtaining on both browsers the logs and downloading them to a file.
Chrome
First of all you should restart the browser as it keeps track of all WebRTC connections. Once restarted, open a new tab and point to “chrome://webrtc-internals/” URL. You should see something like this:

Now open on a new tab your application and reproduce the problem. On the webrtc-internals tab should have appeared two new tabs as shown below.
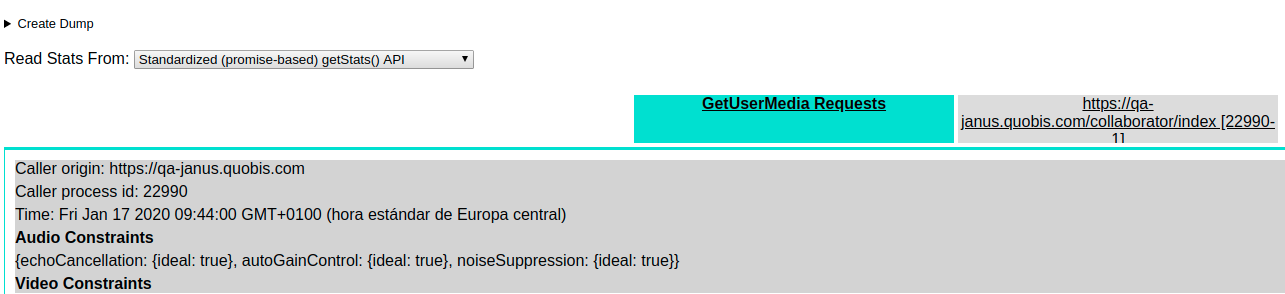
Select the one with the name of the application and click the Download the PeerConnection updates and stats data button.
After downloading, you will obtain a plain text file (extension TXT), remember to attach it to your Quobis support ticket. For debugging purposes, you can use your favorite editor to examine the content.
Firefox
For the same reason as in Chrome you should firstly restart your browser. Then, open a new tab pointing to “about:webrtc”.
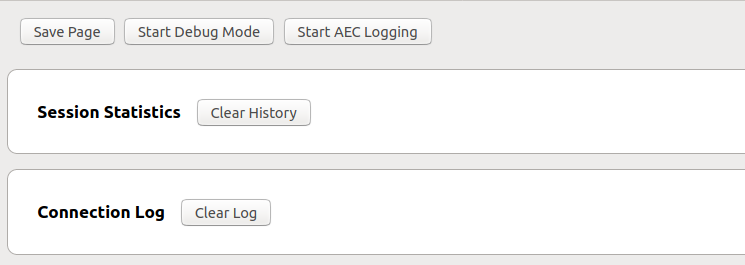
Now open the application and reproduce the problem. Go back, without closing the application, to the “about:webrtc” tab and click Save Page.
After downloading, you will obtain an HTML file, which can be visualized in any browser. Remember to attach it to your Quobis support ticket.
Getting logs from mobile applications
Android applications
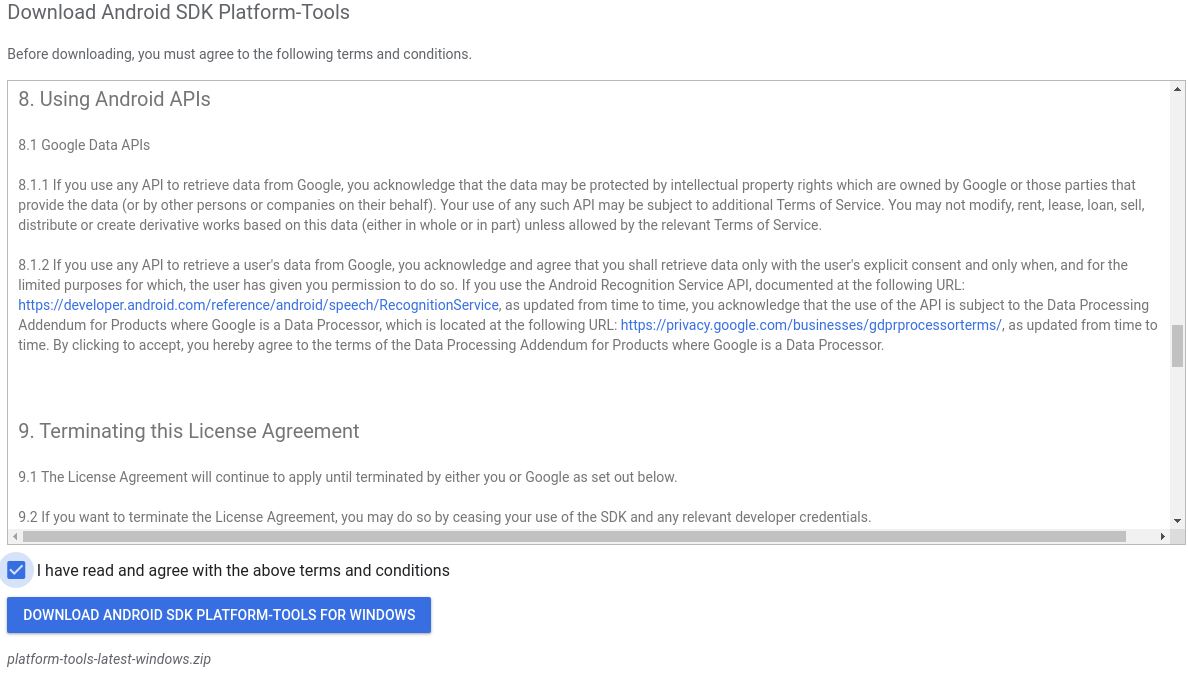
First of all, download the platform SDK tools for the operating system the computer has from the following link: https://developer.android.com/studio/releases/platform-tools.
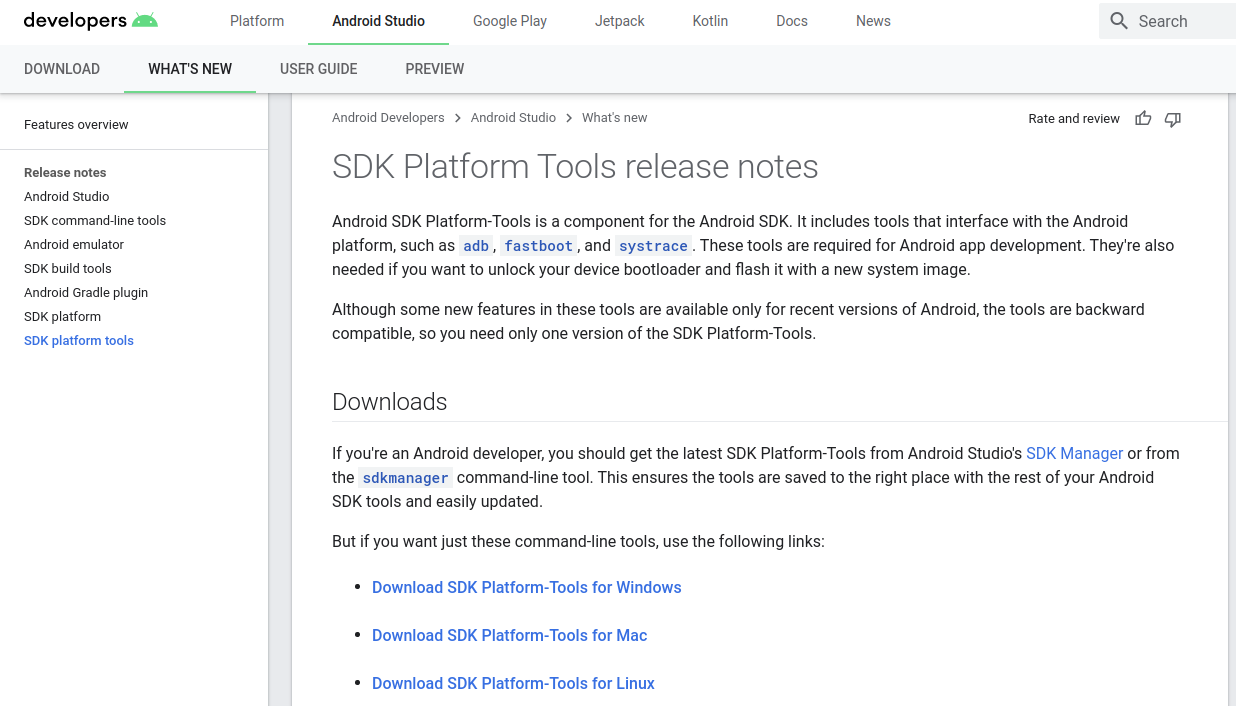
Select the appropriate version and agree to the terms and conditions.
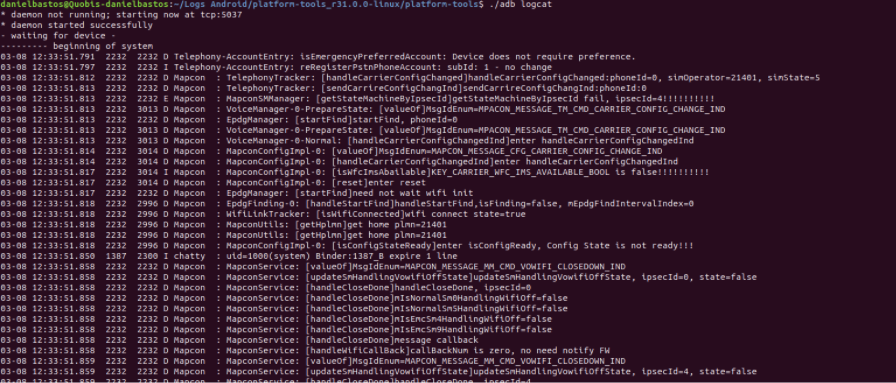
Then, extract the compressed file to a directory of your choice. The extracted folder contains a logcat. Logcat is a command line tool that writes in a file the system messages, including the errors and messages generated by the application. Open a terminal and execute the adb file:

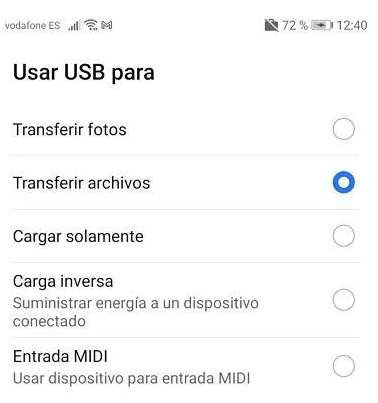
When this is done, connect the Android device to the PC and select “File transfer” in the connection options:
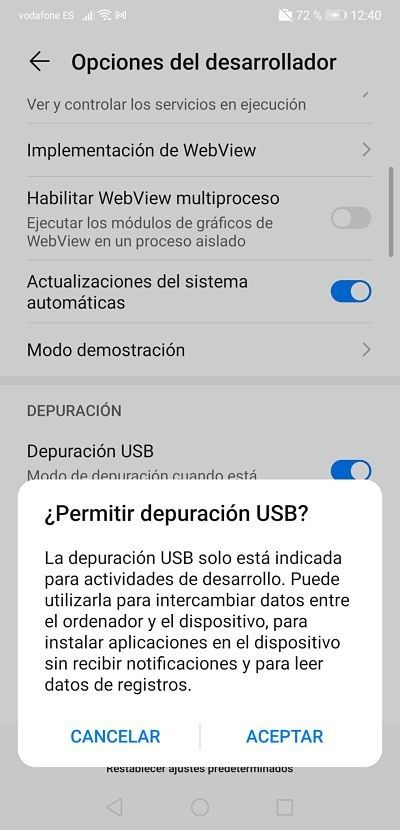
Next, enable the developer options in the mobile device. This is usually done by tapping several times in the Build Number. Then go to Developer options and enable USB debugging.
Finally, allow USB debugging for the PC.
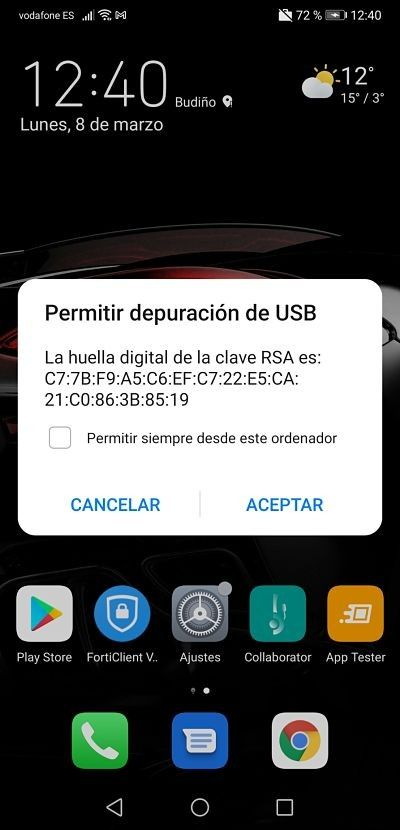
Now, you can open the application that you want to diagnose and reproduce the problem. Save the console output from the PC terminal.
iOS application
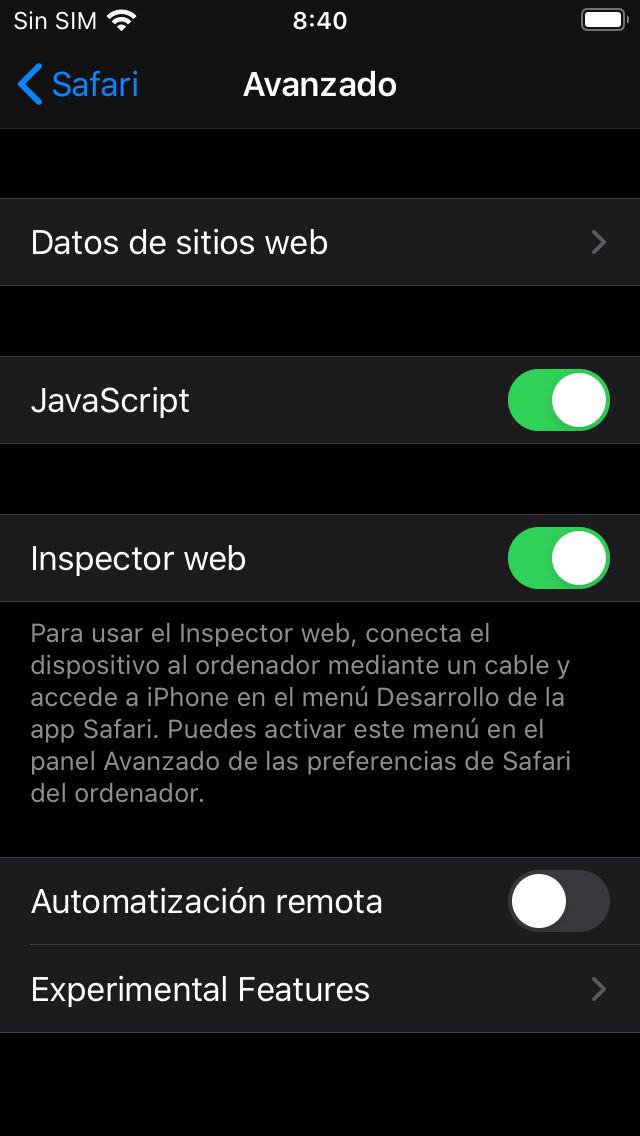
First of all you need to install the debug application on the device. Afterwards, enable the Safari web inspector in Settings > Safari > Advanced > Web Inspector
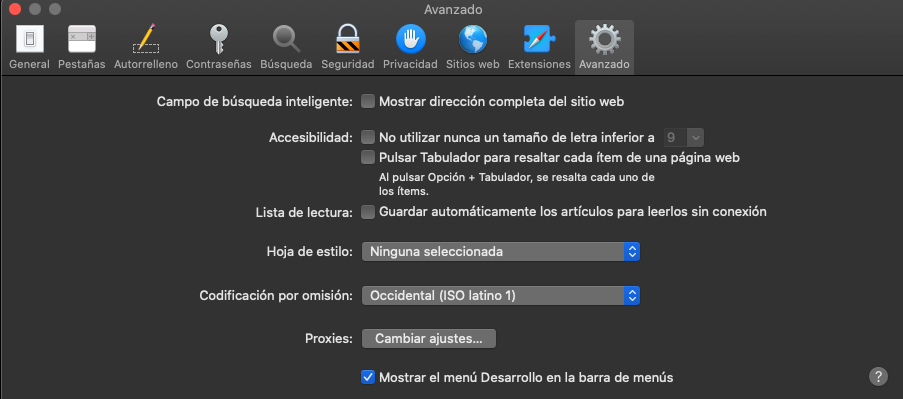
Now connect the iOS device to macOS via wire and enable the developer menu in the macOS Safari:
Safari > Preferences > Advanced > Show development menu in the menu bar
Once applied, restart Safari and open the iOS application. If now you open Safari in the macOS and go to Development, you should see the iOS device and the name of the application within.
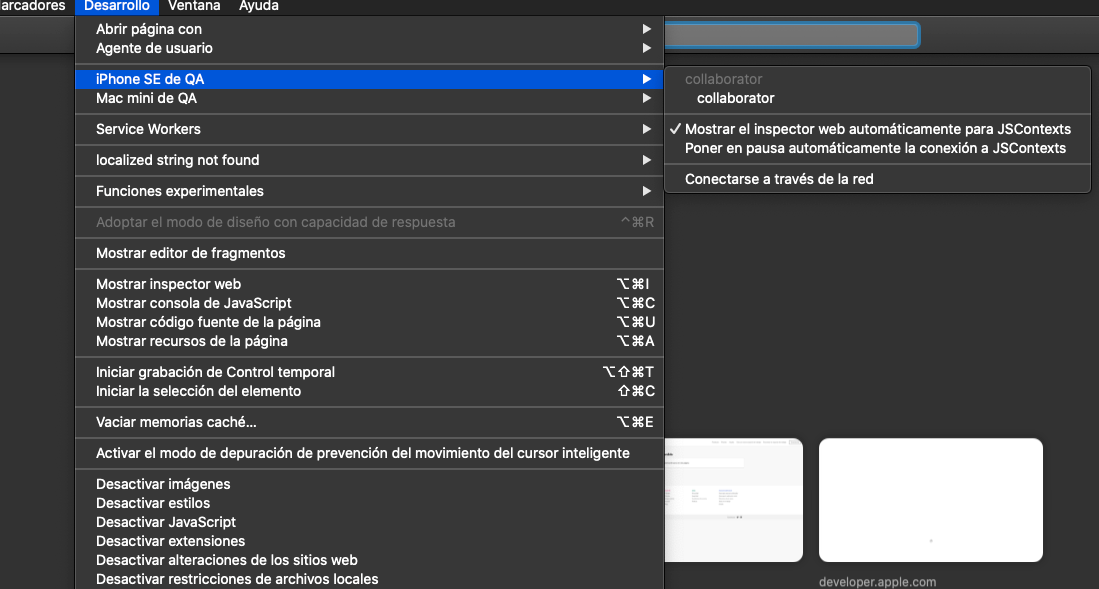
If you click on the name of the application (Quobis collaborator in the previous example), you will be able to see all the logs that come out through the console.