Quobis manager user guide
Getting started
Acccess to Quobis manager
In order to use the Quobis manager application you must first open a compatible browser and navigate to the URL provided by your system administrator. By default it may be your Quobis wac main URL followed by /manager. This URL will take you to the Quobis manager login page.
Logging in
From this login page you can select the language to use for the whole session.
To initiate a session in Quobis manager you must provide a valid system administrator credentials which should be composed of a combination of username and password. Also an “external login” button is available to authenticate via an external provider.
General overview
Once you are logged in you will see a screen similar to the following one.
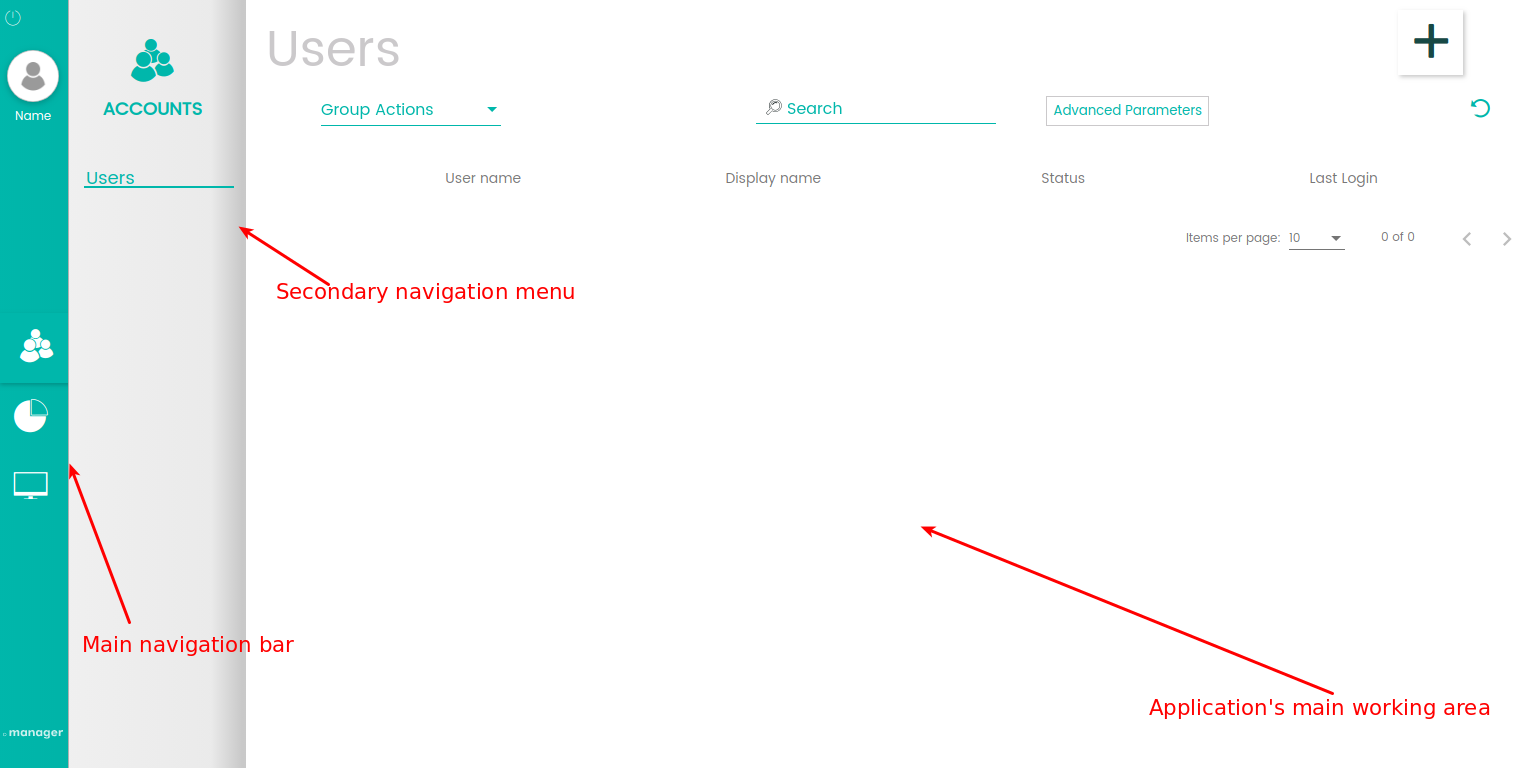
The application’s layout is divided into three sections. Starting from the left, we have the main navigation bar, a secondary navigation menu and, on the right side, the application’s main working area. This space will be used by the user to interact with the application. The navigation bar has three icons, corresponding to the three main application’s sections.
Terminating the session
To log out of your session from any screen inside Quobis manager just reach the power button located in the navigation bar’s upper left corner.
Account management
Users
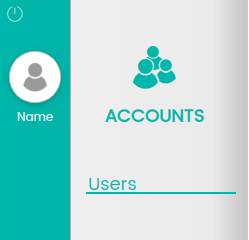
Selecting “users” in the left panel will display a list of accounts registered on the system. This list will show by default six columns:
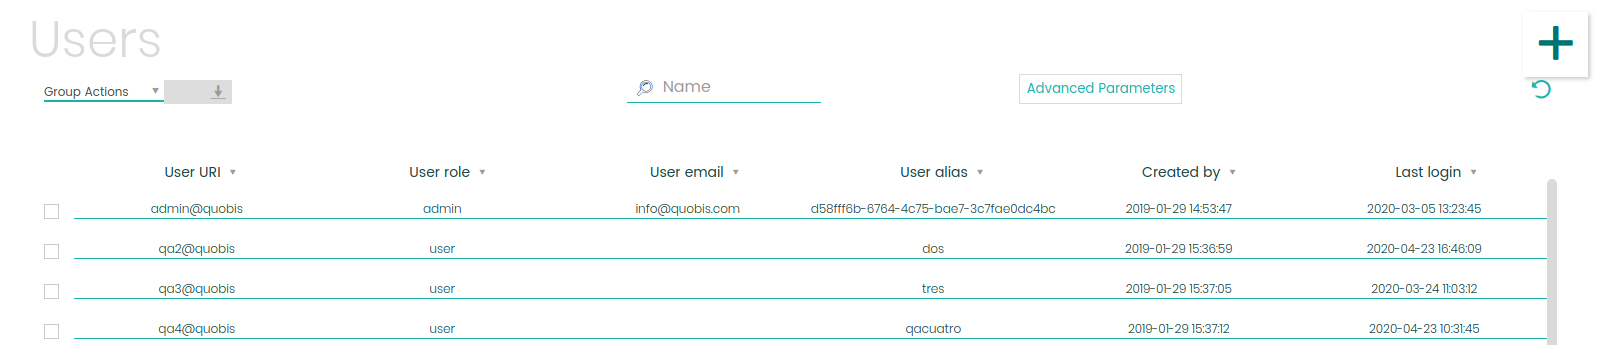
User URI. Consisting of username and domain.
Role. Admin, user or anonymous.
Email. Account associated email.
Alias name. Unique user identifier.
Created. Date and time in which the user was included into the platform.
Last login. User’s last login date and time.
In order to locate one or several users from the list you have the following options:
Search by name using the top search box.
Use filters located under the
 button. Two filters can be applied:
Status. Which will let you select between Not Available, Available and Disable users.
Last login. Where you can select a from and to time instances where a user made its last login into the platform
Sort by a specified column by clicking on the column title.
Once located, you can select a user by clicking on it. This will display a detailed view where you will be able to see the account’s information as well as the groups and agendas it associates with. You can also select group of users by marking the checkboxes next to the Username column and perform an action over all of them together.
Adding a new user
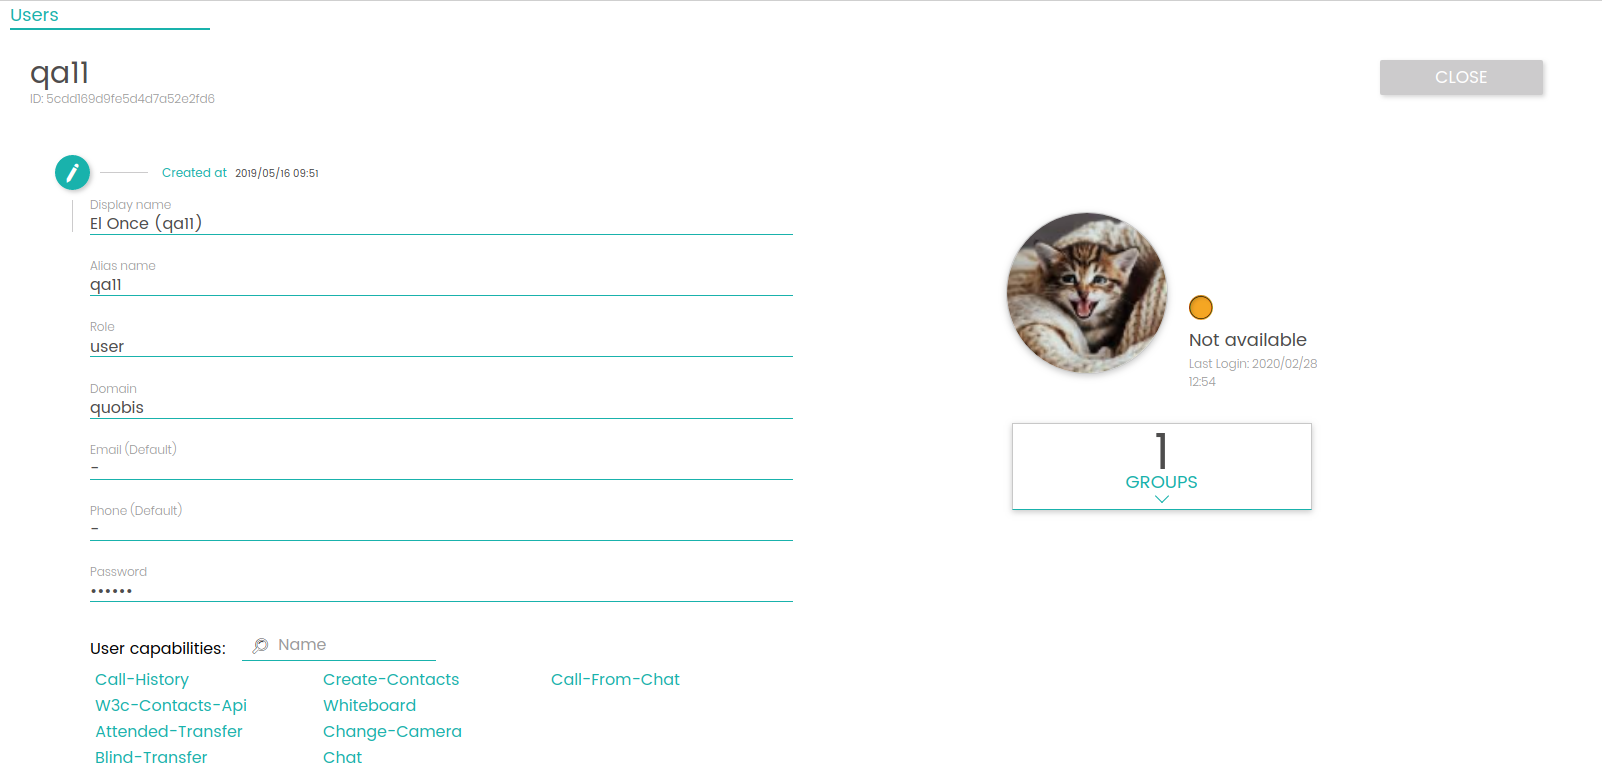
To add a new user click on the  icon on the upper right corner of the screen. A new form will appear in order to configure the following attributes:
Following the order shown in the image:
Username. Name by which the user is registered. It may not match with the display name.
Profile picture. User’s avatar image.
Display name. Name seen by the user and its contacts.
Alias name. A unique string which identifies the user inside the system. It’s generated when a new user is added and cannot be modified.
Role. Available to choose between user, admin or anonymous.
Domain. User’s domain.
Email. User’s email.
Phone. User’s phone. More than one phone number can be added to a same user tapping the
icon next to this inputPassword. Account’s password. Clicking on “generate” automatically generates a 8 alphanumeric character password.
Capabilities. Two lists are displayed, being the one on the left, all the available capabilities and the one on the right the ones the user will acquire. You can add or take capabilities from the user just by dragging them from one list to the other
After filling in all required fields click (in the upper right corner of the screen) on  to register the new user into the platform or
  to dismiss this screen.
Note
All required fields are accompanied by a Please check this field side note. A new user account cannot be created until all these fields are correctly covered.
Editing users
To edit a user’s information, on the detailed view, click on the edit button next to the display name text box.
By doing so, an edit screen will reveal where you will be able to change any of the attributes mentioned when creating a new user. From this menu you will also be able to delete the user with the delete user button provided in the top right corner.
Groups
In the left menu click Groups Just like the Users section a list will come up displaying all groups registered in the system. This list is composed of six columns:
Group name.
Group ID.
Users.
Phonebooks. Indicates phonebooks the group owns.
Created by. Shows the display name of the creator.
Creation date.
Monitoring
This section of the application is available by clicking the corresponding icon in your navigation bar. A new tab will open giving access to a Grafana web interface. Grafana is an open source analytics and visualization platform which allows to query and visualize different metrics relevant to your Quobis deployment. To access the Grafana UI user credentials will be required, these are set up during the Quobis wac installation phase. The interface is designed around dashboards which are a quick way of visualizing data and the current state of the deployment. It also incorporates Loki, a log aggregation system which allows for an easy visualization and filtering of Quobis logs.
Note
More information about Grafana and Loki can be found on the Grafana official website.
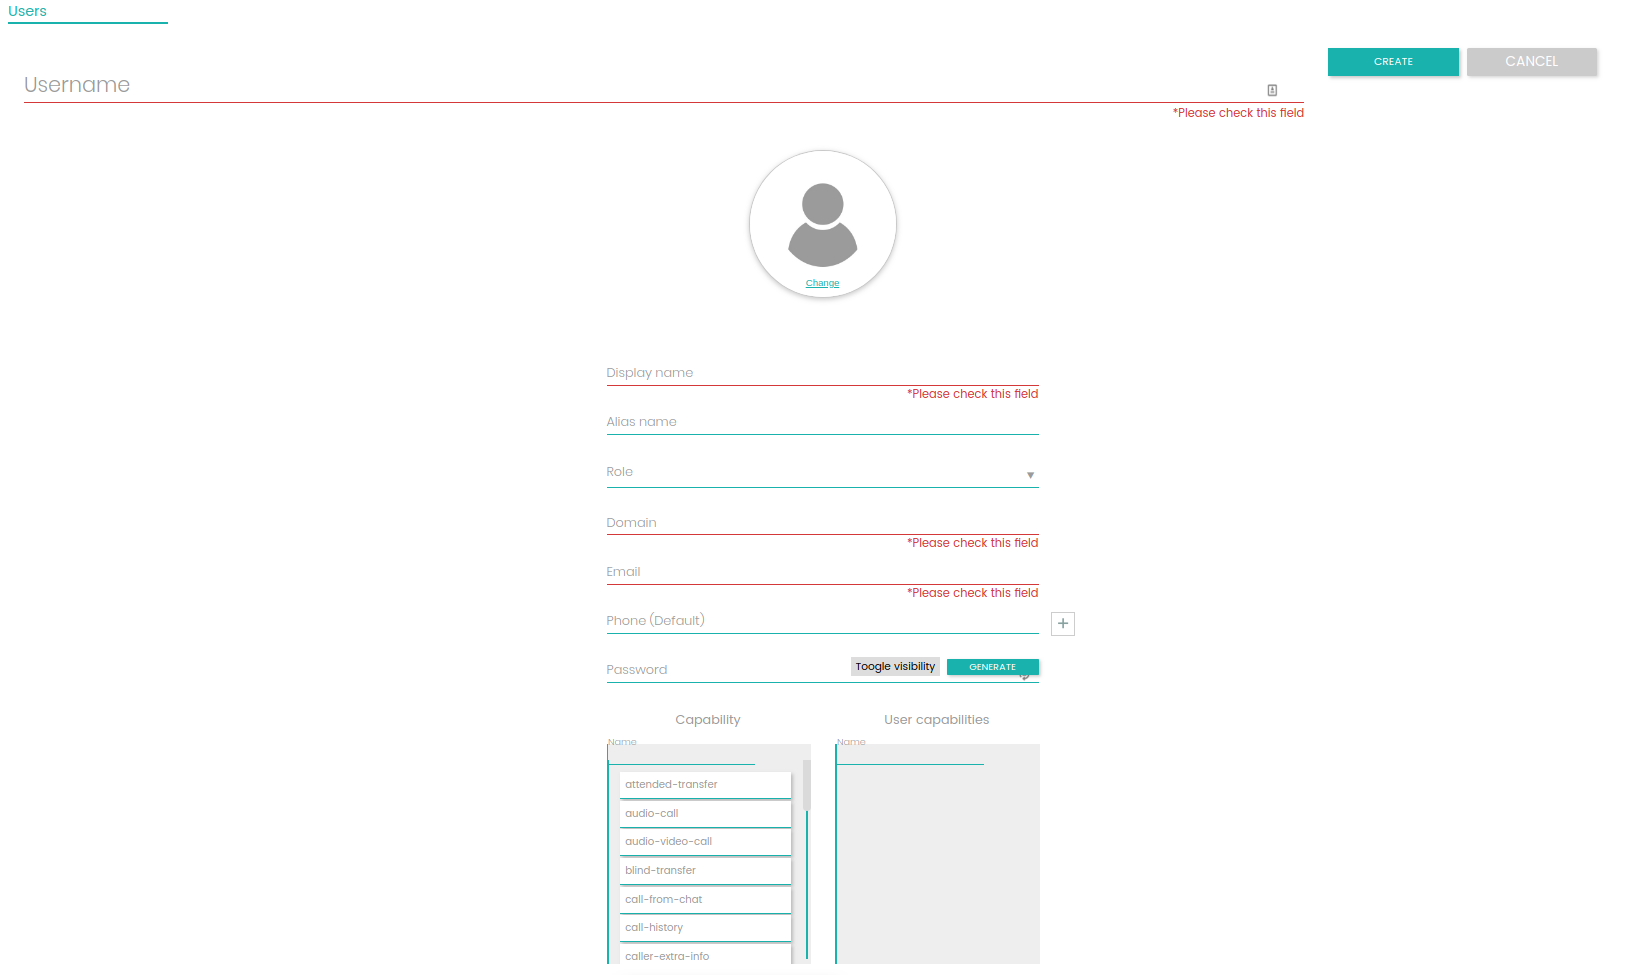
Dashboards
The interface is divided into several dashboards, each one giving information about a different topic related to the deployment. Dashboards can be added, modified or eliminated, although deployment comes with several pre-configured useful dashboards.
Kubernetes cluster. Displays system resources usage for the whole cluster, divided by processes and instances
Main. Shows a summary of system resource usage.
Database. Displays information about Quobis’s database
In all dashboards, from the top menu you can select the node to collect data from (in case your deployment handles more than one node) as well as the range from when to visualize the data.
Logging
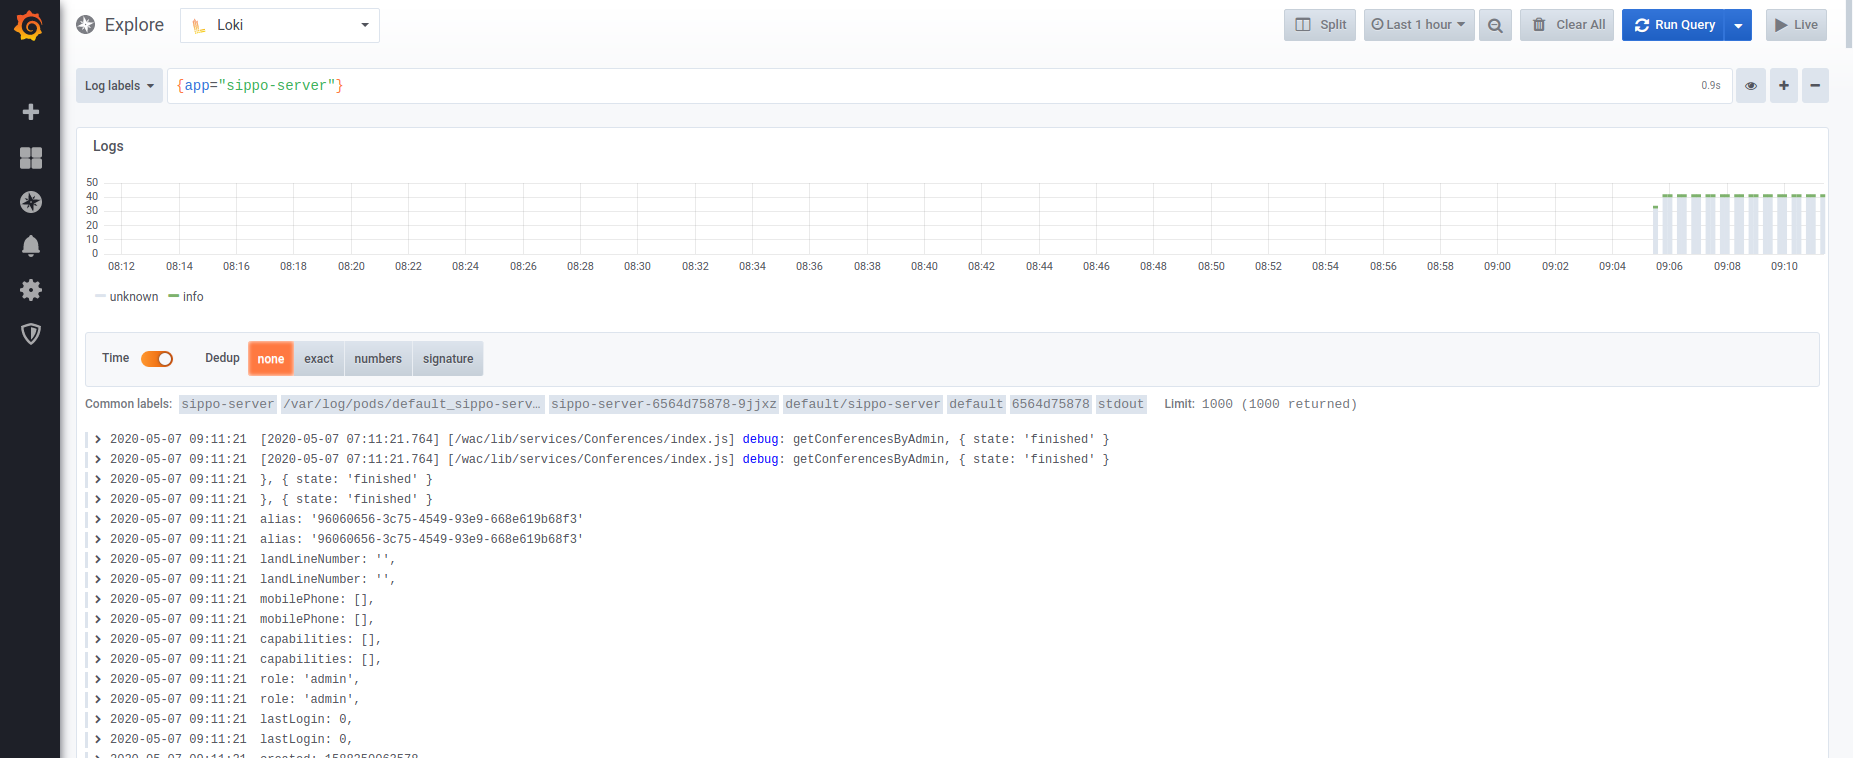
Loki logs can be accessed by tapping on the explore button and selecting Loki from the dropdown menu at the top of the screen. In Log Labels, the app dropdown menu allows to select the running process for which to visualize the logs. Further querying selectors are available in that same menu that make it possible to filter by different criteria.
Note
Loki also allows for more complex search expressions using operators (see Loki Log Queries).
For extra information about the log querying syntax check https://github.com/grafana/loki/blob/master/docs/logql.md
The log queries are composed by two main parts inside brackets: a log stream selector, and a search expression. For performance reasons you need to start by choosing a log stream by selecting a log label.
{job="sippo-server"} |= "error" != "timeout"
---- Stream --------    ---- Search exp ----
Stream selector
Allows to select the logs source. Multiple streams, and several expressions for the stream selector can also be added.
For the label part of the query expression, wrap it in curly braces {} and then use the key value syntax for selecting labels. Multiple label expressions are separated by a comma:
{app="mysql",name="mysql-backup"}
The following label matching operators are currently supported:
=exactly equal.!=not equal.=~regex-match.!~do not regex-match.
Search expression
Allows to filter the content from the stream selected. The search expression can be just text or a regex expression. Example queries:
{job="mysql"} |= "error"
{name="kafka"} |~ "tsdb-ops.*io:2003"
{instance=~"kafka-[23]",name="kafka"} != "kafka.server:type=ReplicaManager"
Filter operators can be chained and will sequentially filter down the expression. The resulting log lines will satisfy every filter. Example:
{job="mysql"} |= "error" != "timeout"
The following filter types are currently supported:
|=line contains string.!=line doesn’t contain string.|~line matches regular expression.!~line does not match regular expression.
Reporting
The reporting section inside Quobis manager is responsible for displaying a detailed view of events relative to the whole system.
Conferences
Consists of a detailed record of all conferences (one to one calls or multi-user conference calls) performed on the platform. This call detail record contains data fields that describe an instance of a call transaction, but does not include the content of the transaction itself.
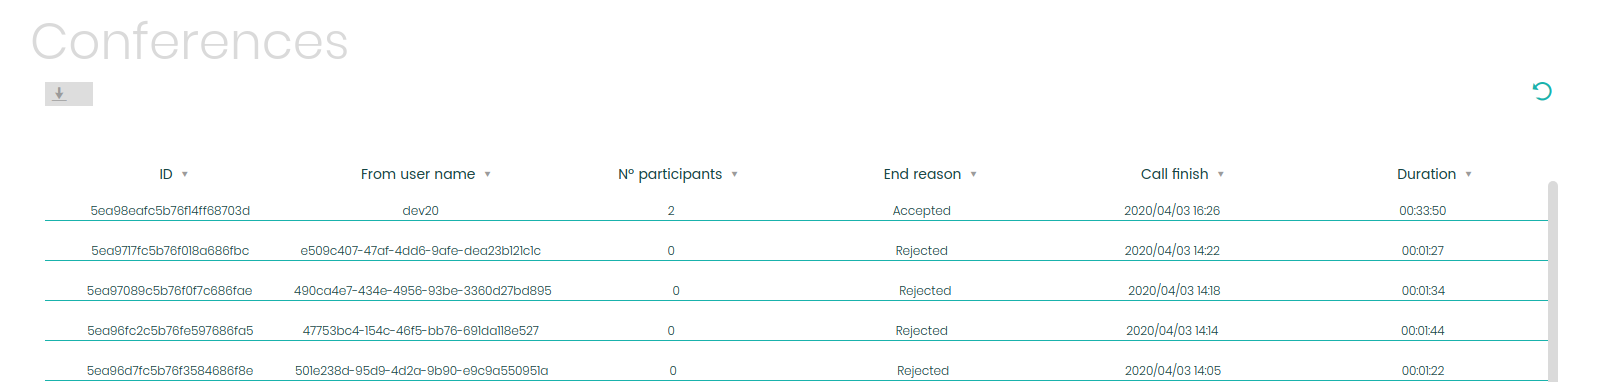
Attributes of the record are divided into columns:
ID. Transaction unique identifier. Used for cross referencing with system logs.
From user name. Username of the caller, the owner of the room or the user that creates the room itself.
Nº participants. Maximum number of users participating in the conference.
End reason. Last status received from the conference or call. Can take one of the following values:
ringing
active
normal end
busy
network
error
admin end
Call start. Room creation timestamp.(Or first user joining the call timestamp).
Call finish. Room destruction timestamp. (Or last user abandoning the call timestamp).
Duration. Time between call start and call finish.
The whole record can also be exported into a CSV file using the download button located in the upper left corner of the screen.