Monitoring
Monitoring has been built with the opensource tool Grafana. The URL of the Grafana access is https://base_url:/grafana and the credentials must be provided by Quobis support. It shows different dashboards with the live metric/logs values and metric history. By default the following dashboards are included:
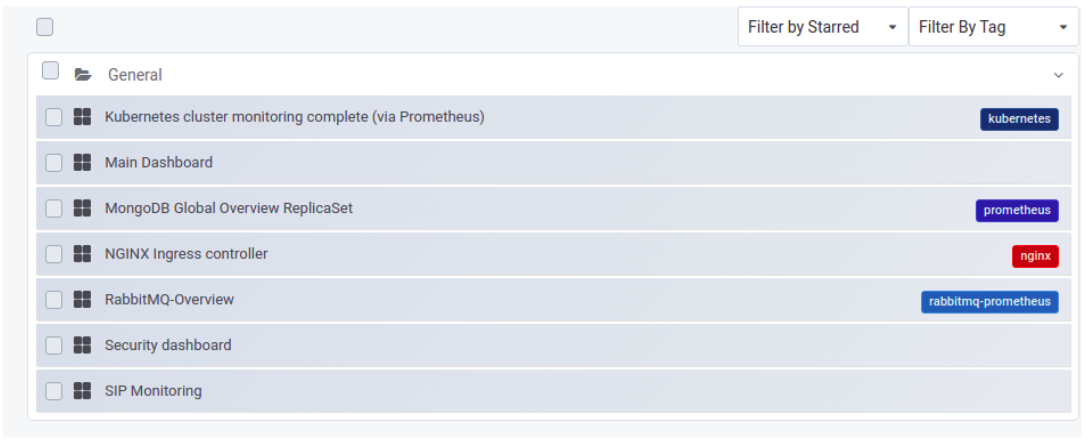
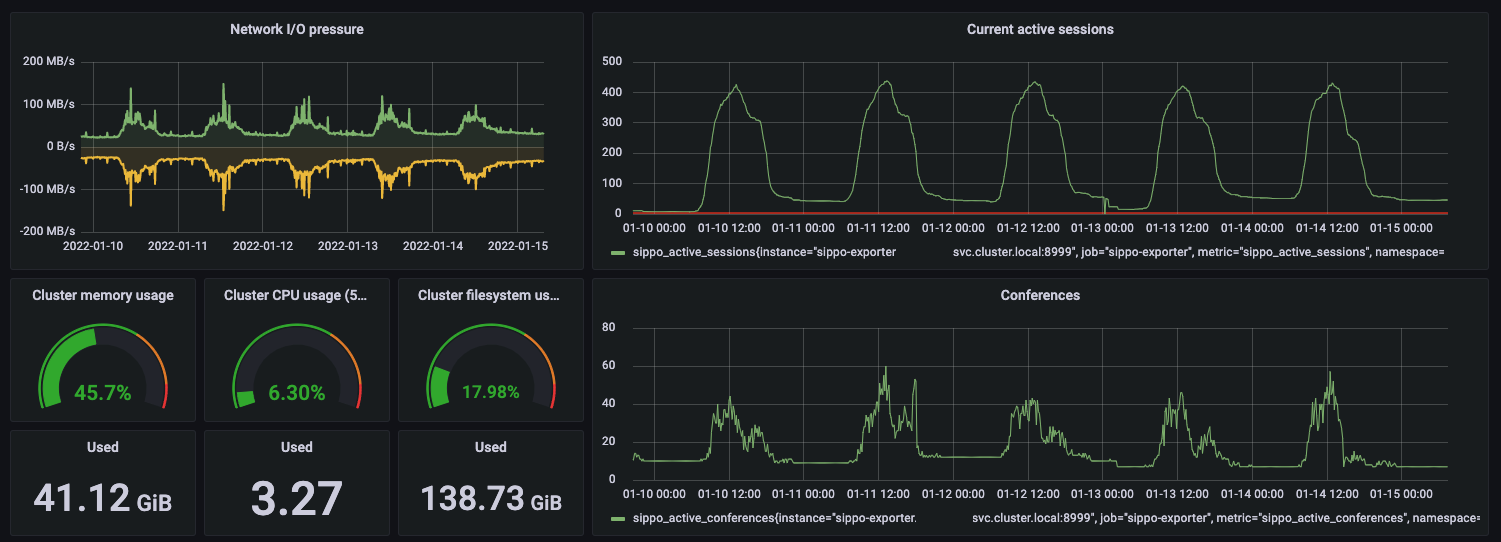
In order to provide a first check of the system, the Kubernetes cluster monitoring dashboard where the resources of the cluster is shown. Below you can see a screenshot of a running system during five working days:
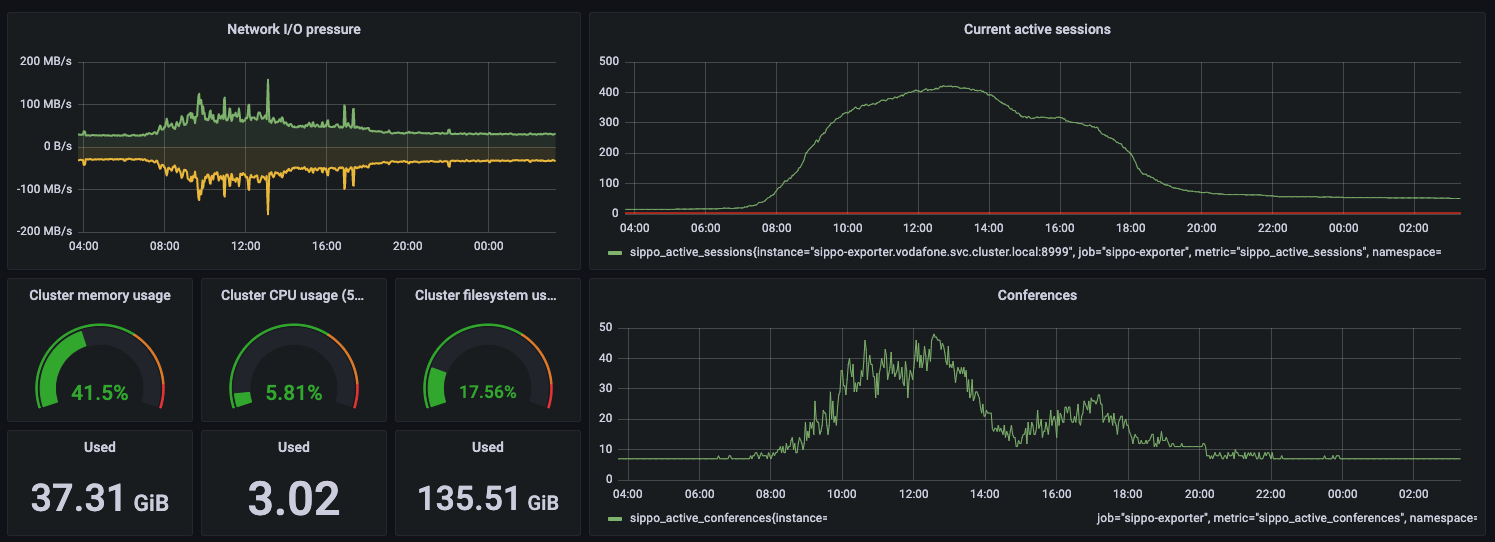
This is another screenshot during a normal day, where we can see the correlation between connected users, concurrent conferences and the network bandwith:
It also provides the alerting service, where the following alerts are included by default in the deployment:
VM CPU/RAM/DISK usage.
Internal traffic load (inside the cluster)
Pods and container CPU/RAM/DISK usage.
Database status
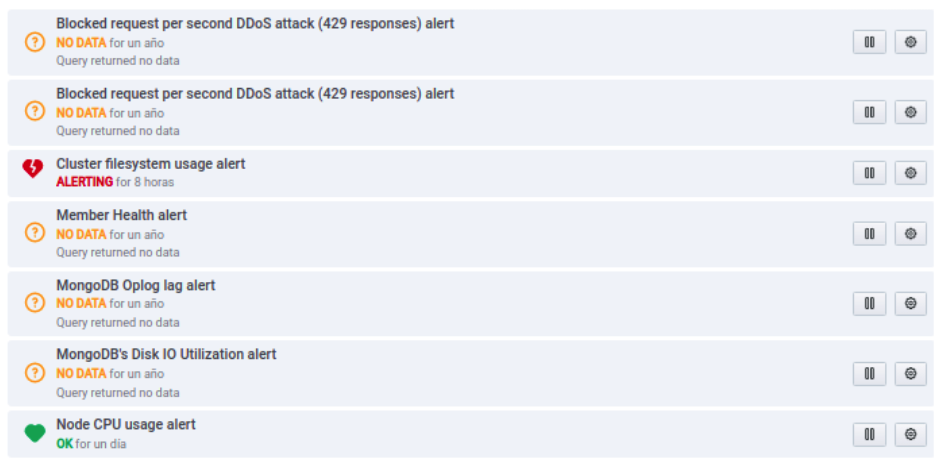
Example of alerts fired in the system
Several alerts can be added in function on the needs of the deployment. The following image describes the configuration of an alert:
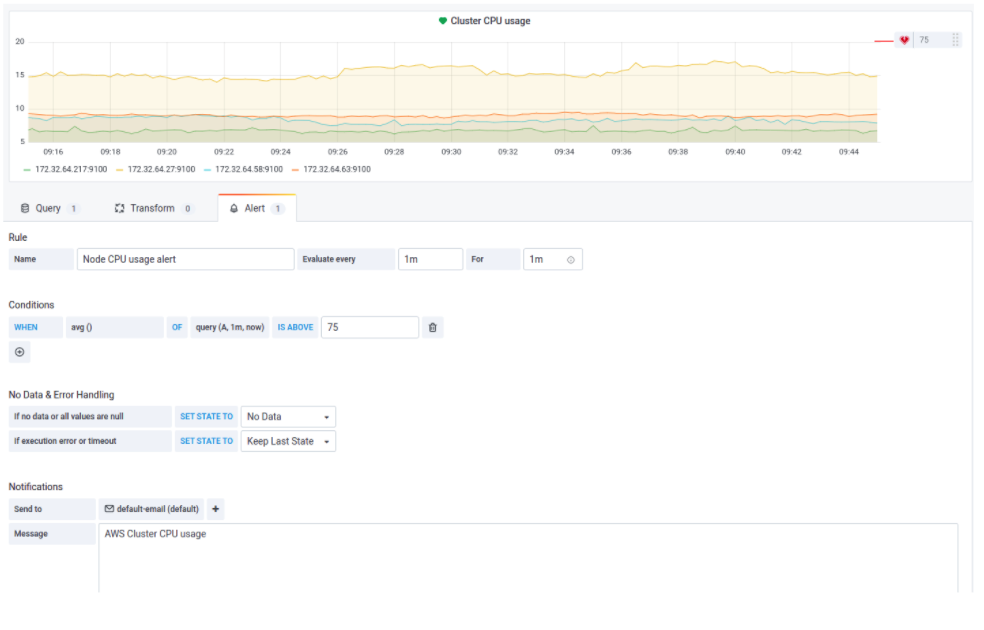
Example of the alert configuration