Log analysis
This chapter describes the logs available with the Quobis Communication Platform and explains how to access and view them. It also explains the relationship between logs and system events. In order to get logs form the pods deployed into the Kubernetes cluster, we use the following command:
1 $ kubectl logs -f $Service-name > log-$servicename.log
On the other hand, there is a Loki service available that is integrated into Grafana for a better log collection experience.
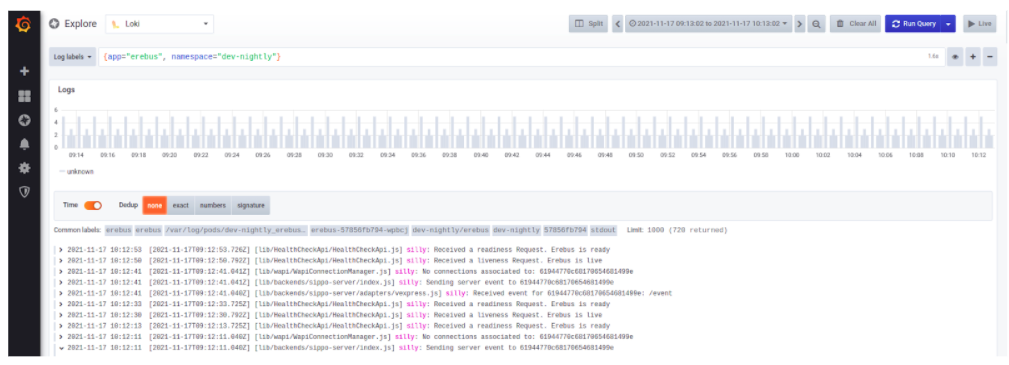
Log view and inspection with Loki tool within Grafana
We can find logs by string in order to trace an event or make troubleshooting easier.
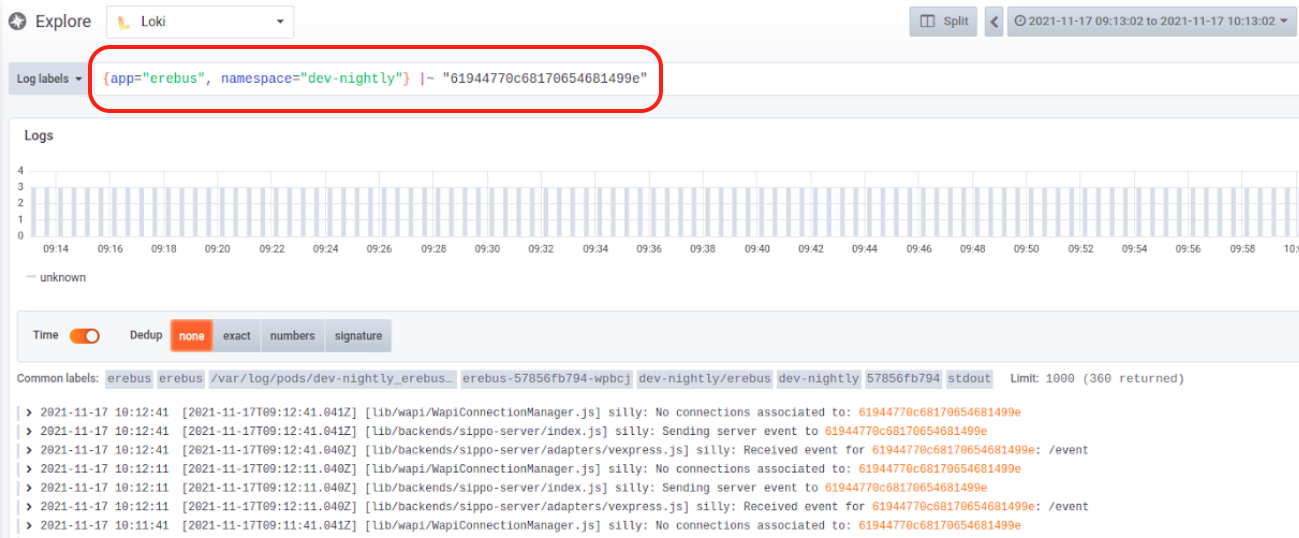
Example of searching and filtering
To explore further, go to the Json and Data tabs. Here you can inspect the payloads and the responses of the logged data sent to Loki. Below, we can see options of how we can download the logs from Grafana from the Data tab on Grafana Loki. The options provided by Grafana Loki are to download the data as a CSV file or as a log file that can then be shared with other logging platforms if needed.
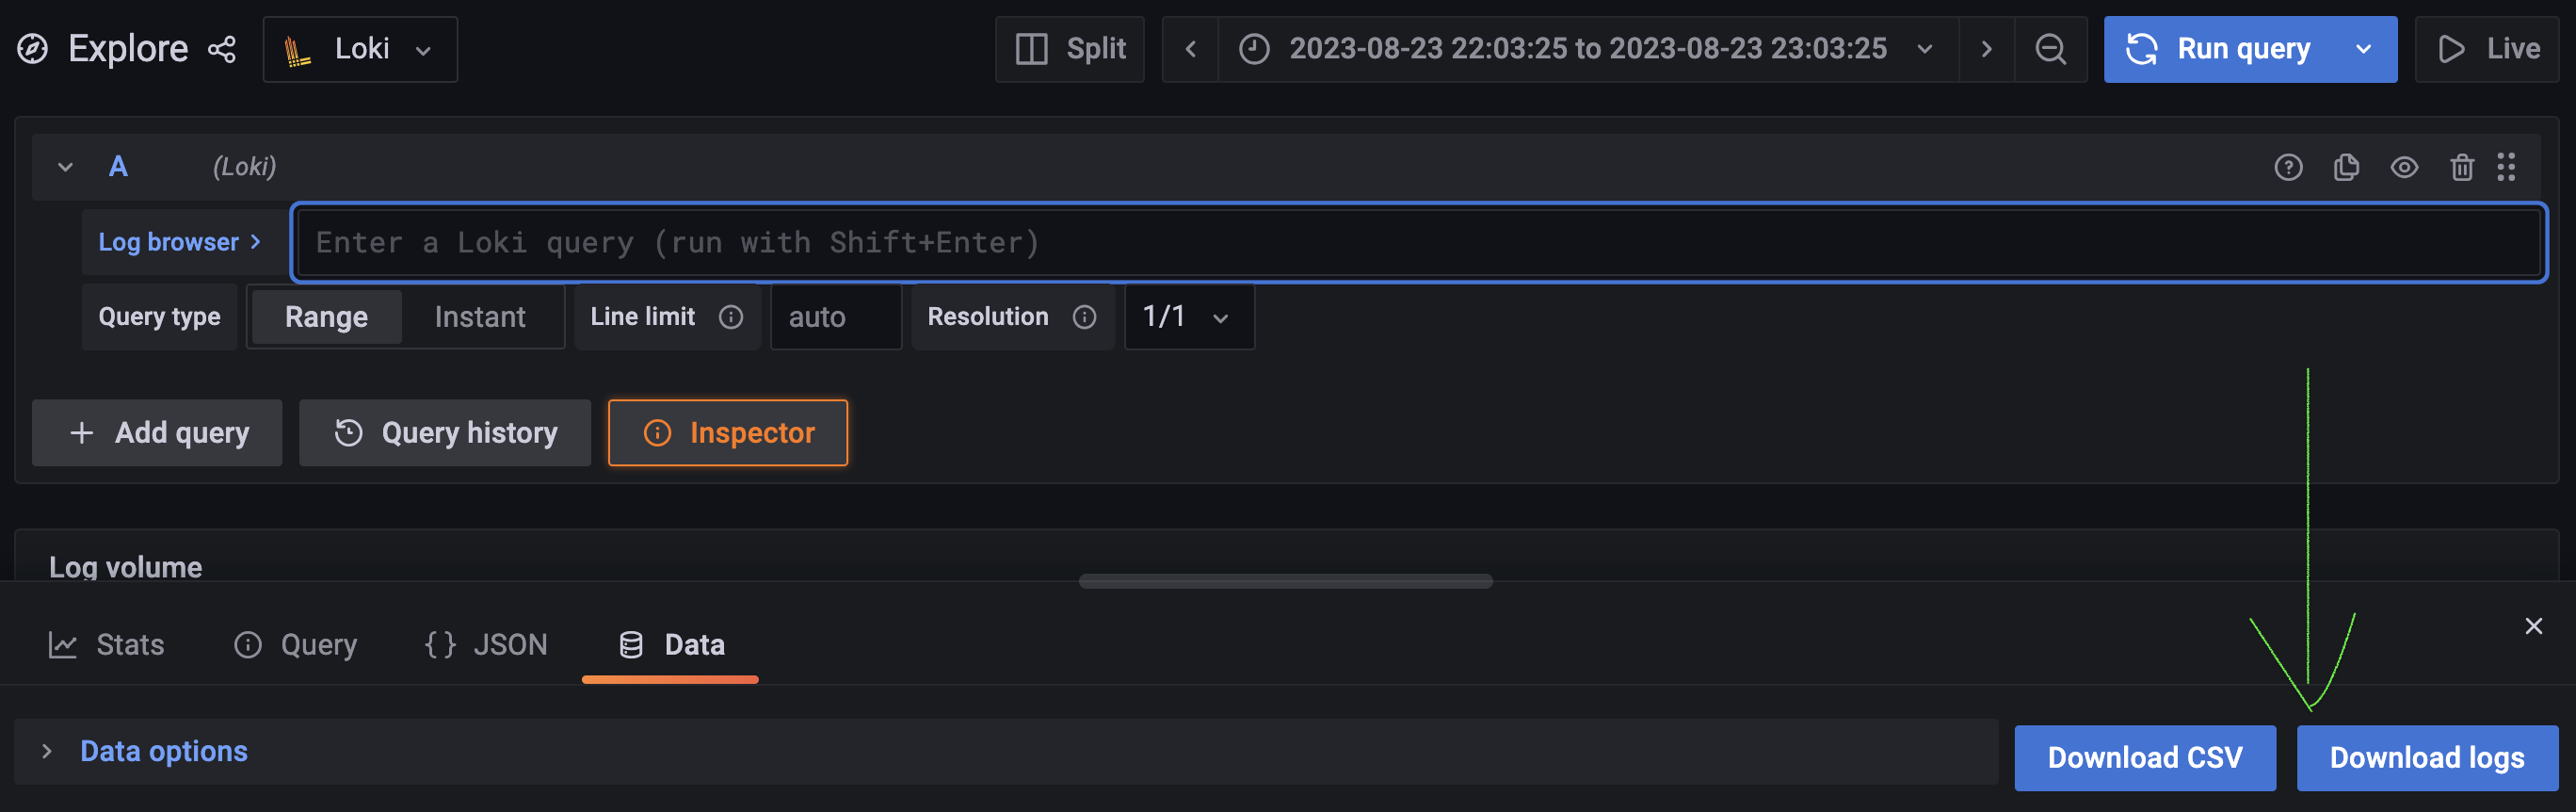
Where to download logs in CSV and TXT
Log levels
Each log message has an associated log level that gives a rough guide to the importance and urgency of the message. These are the available log levels in the platform, from more severe to less severe:
Level name |
Level description |
|---|---|
‘error’ |
Error events of considerable importance that will prevent normal program execution, but might still allow the application to continue running. |
‘warning’ |
Potentially harmful situations of interest to end users or system managers that indicate potential problems. |
‘info’ |
Informational messages that might make sense to end users and system administrators, and highlight the progress of the application. |
‘verbose’ |
Informational messages with more detailed information |
‘debug’ |
Information broadly interesting to developers, might include minor (recoverable) failures and issues indicating potential performance problems. |
‘silly’ |
The most detailed log messages, may contain sensitive application data. |
Each service can have a different log level, the default configuration is as follows:
Service name |
Log level |
|---|---|
|
info |
|
info |
|
silly |
|
info |
|
debug |
|
silly |
|
info |
|
error |
|
debug |
|
info |
|
debug |
|
warning |
|
debug |
|
warning |
|
debug |
|
debug |
|
info |
|
info |
|
warning |
|
info |
|
info |
|
debug |
|
warning |
|
warning |
|
warning |
|
debug |